Skip to content
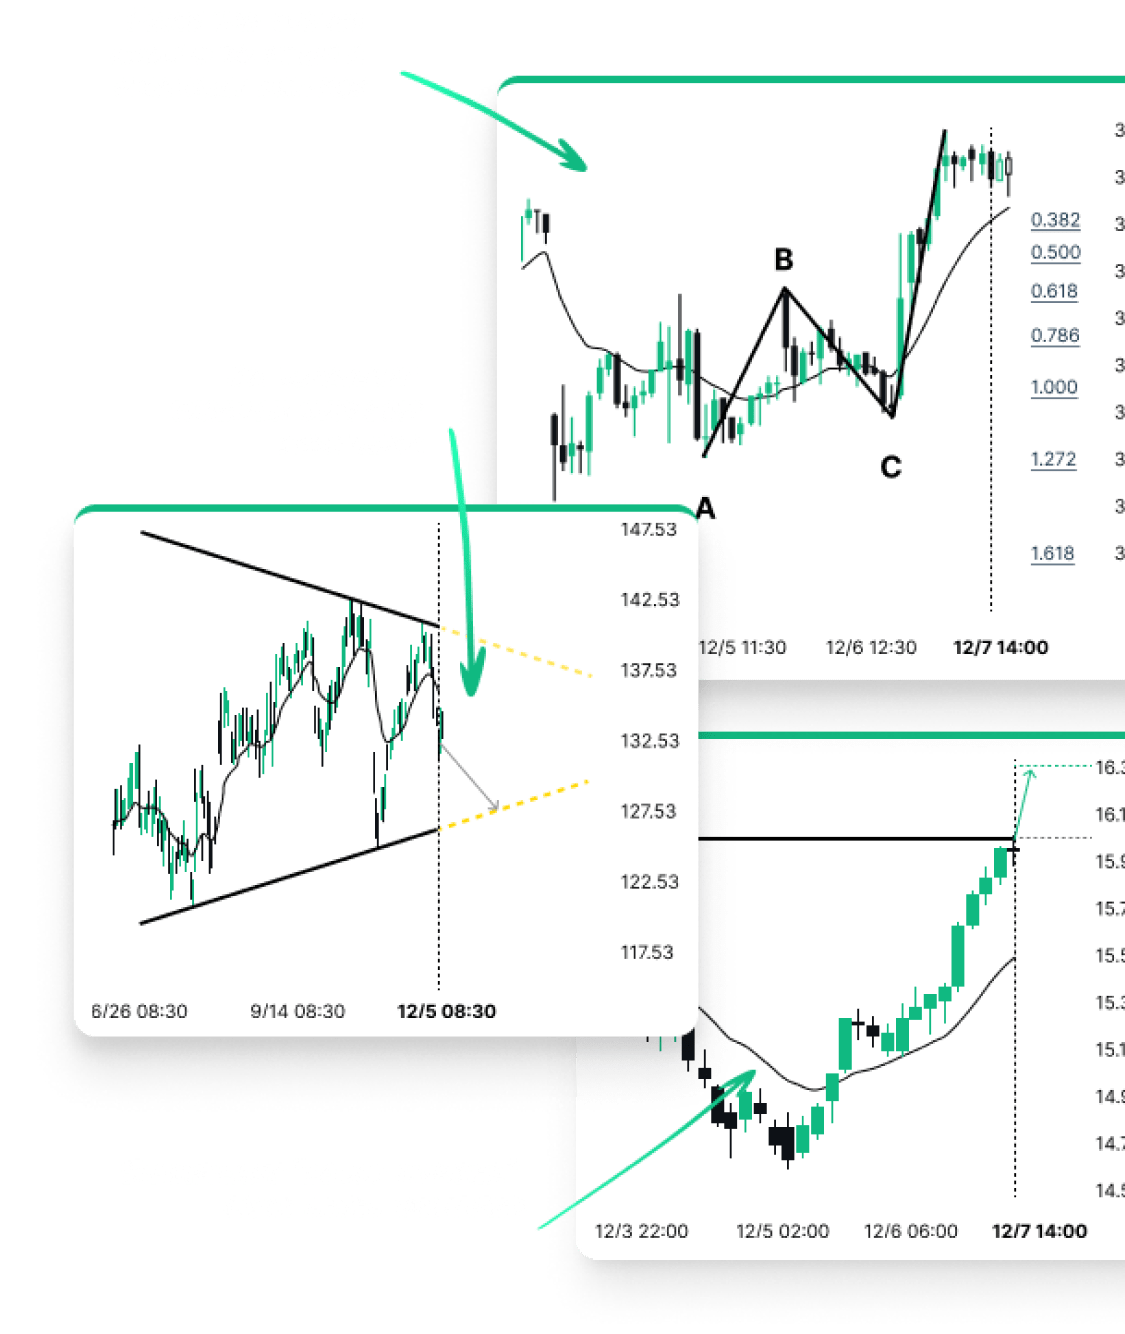
Never miss a trading opportunity with personalised alerts for market movements, volatility, and upcoming macroeconomic events.
Effectively manage risk and potential overexposure in leveraged markets with Autochartist’s innovative Risk Calculator.
Professional analysts can monitor a dozen instruments per day. Autochartist monitors tens of thousands of financial instruments in real time.
Never miss a trading opportunity with personalised alerts for market movements, volatility, and upcoming macroeconomic events.
Effectively manage risk and potential overexposure in leveraged markets with Autochartist’s innovative Risk Calculator.
Benefit from our broad coverage of global markets, including stocks, indices, currencies, bullion, metals, commodities, ETFs, options, and cryptocurrencies.

In the financial markets, filled with hype and fast-moving headlines, it’s easy for traders, especially newer ones, to feel like they’re constantly chasing the next big thing. But most experienced traders don’t jump from trend to trend. They stick to the basics, build on what works, and adjust when the markets shift. Let’s take a […]

There’s one thing guaranteed to move the markets fast: economic events. Whether it’s an unexpected geopolitical event, a central bank rate hike, or a tech giant’s unfavourable earnings report, traders are tuned in, waiting for the next big move. And when those economic announcements hit, decisions are made in seconds, not hours. The challenge? Most […]
Have you noticed a decline in trader activity? Are your clients logging in less frequently, executing fewer trades, and hesitating to redeposit? Maintaining trader engagement is a common challenge for retail brokers worldwide. Effective Trader Engagement Strategies for Retail Brokers can help address these issues. Traders can lose momentum due to market uncertainty, significant losses, […]

Tariffs on, tariffs off! Do you understand the potential impact of tariffs on retail trading? The daily stress of navigating the ever-changing landscape of global trade policies has been intensified recently, with tariff news making headlines in all the popular financial reads. The U.S. administration’s recent tariff implementations have highlighted the need to understand […]

Most online brokers focus heavily on acquiring new traders—allocating large marketing budgets to attract new user sign-ups—but an often overlooked key to sustainable growth lies in trader longevity. A trader’s lifecycle—from when they start trading (opening their first account or making their first deposit) to when they stop trading altogether or become inactive—significantly impacts brokers […]

In recent years, financial literacy has evolved beyond being a personal skill to becoming a powerful social movement. This shift recognises that equitable access to financial knowledge is not just an individual need but a societal necessity. Across the globe, disparities in financial education affect millions, with marginalised communities bearing the brunt of systemic inequities. […]
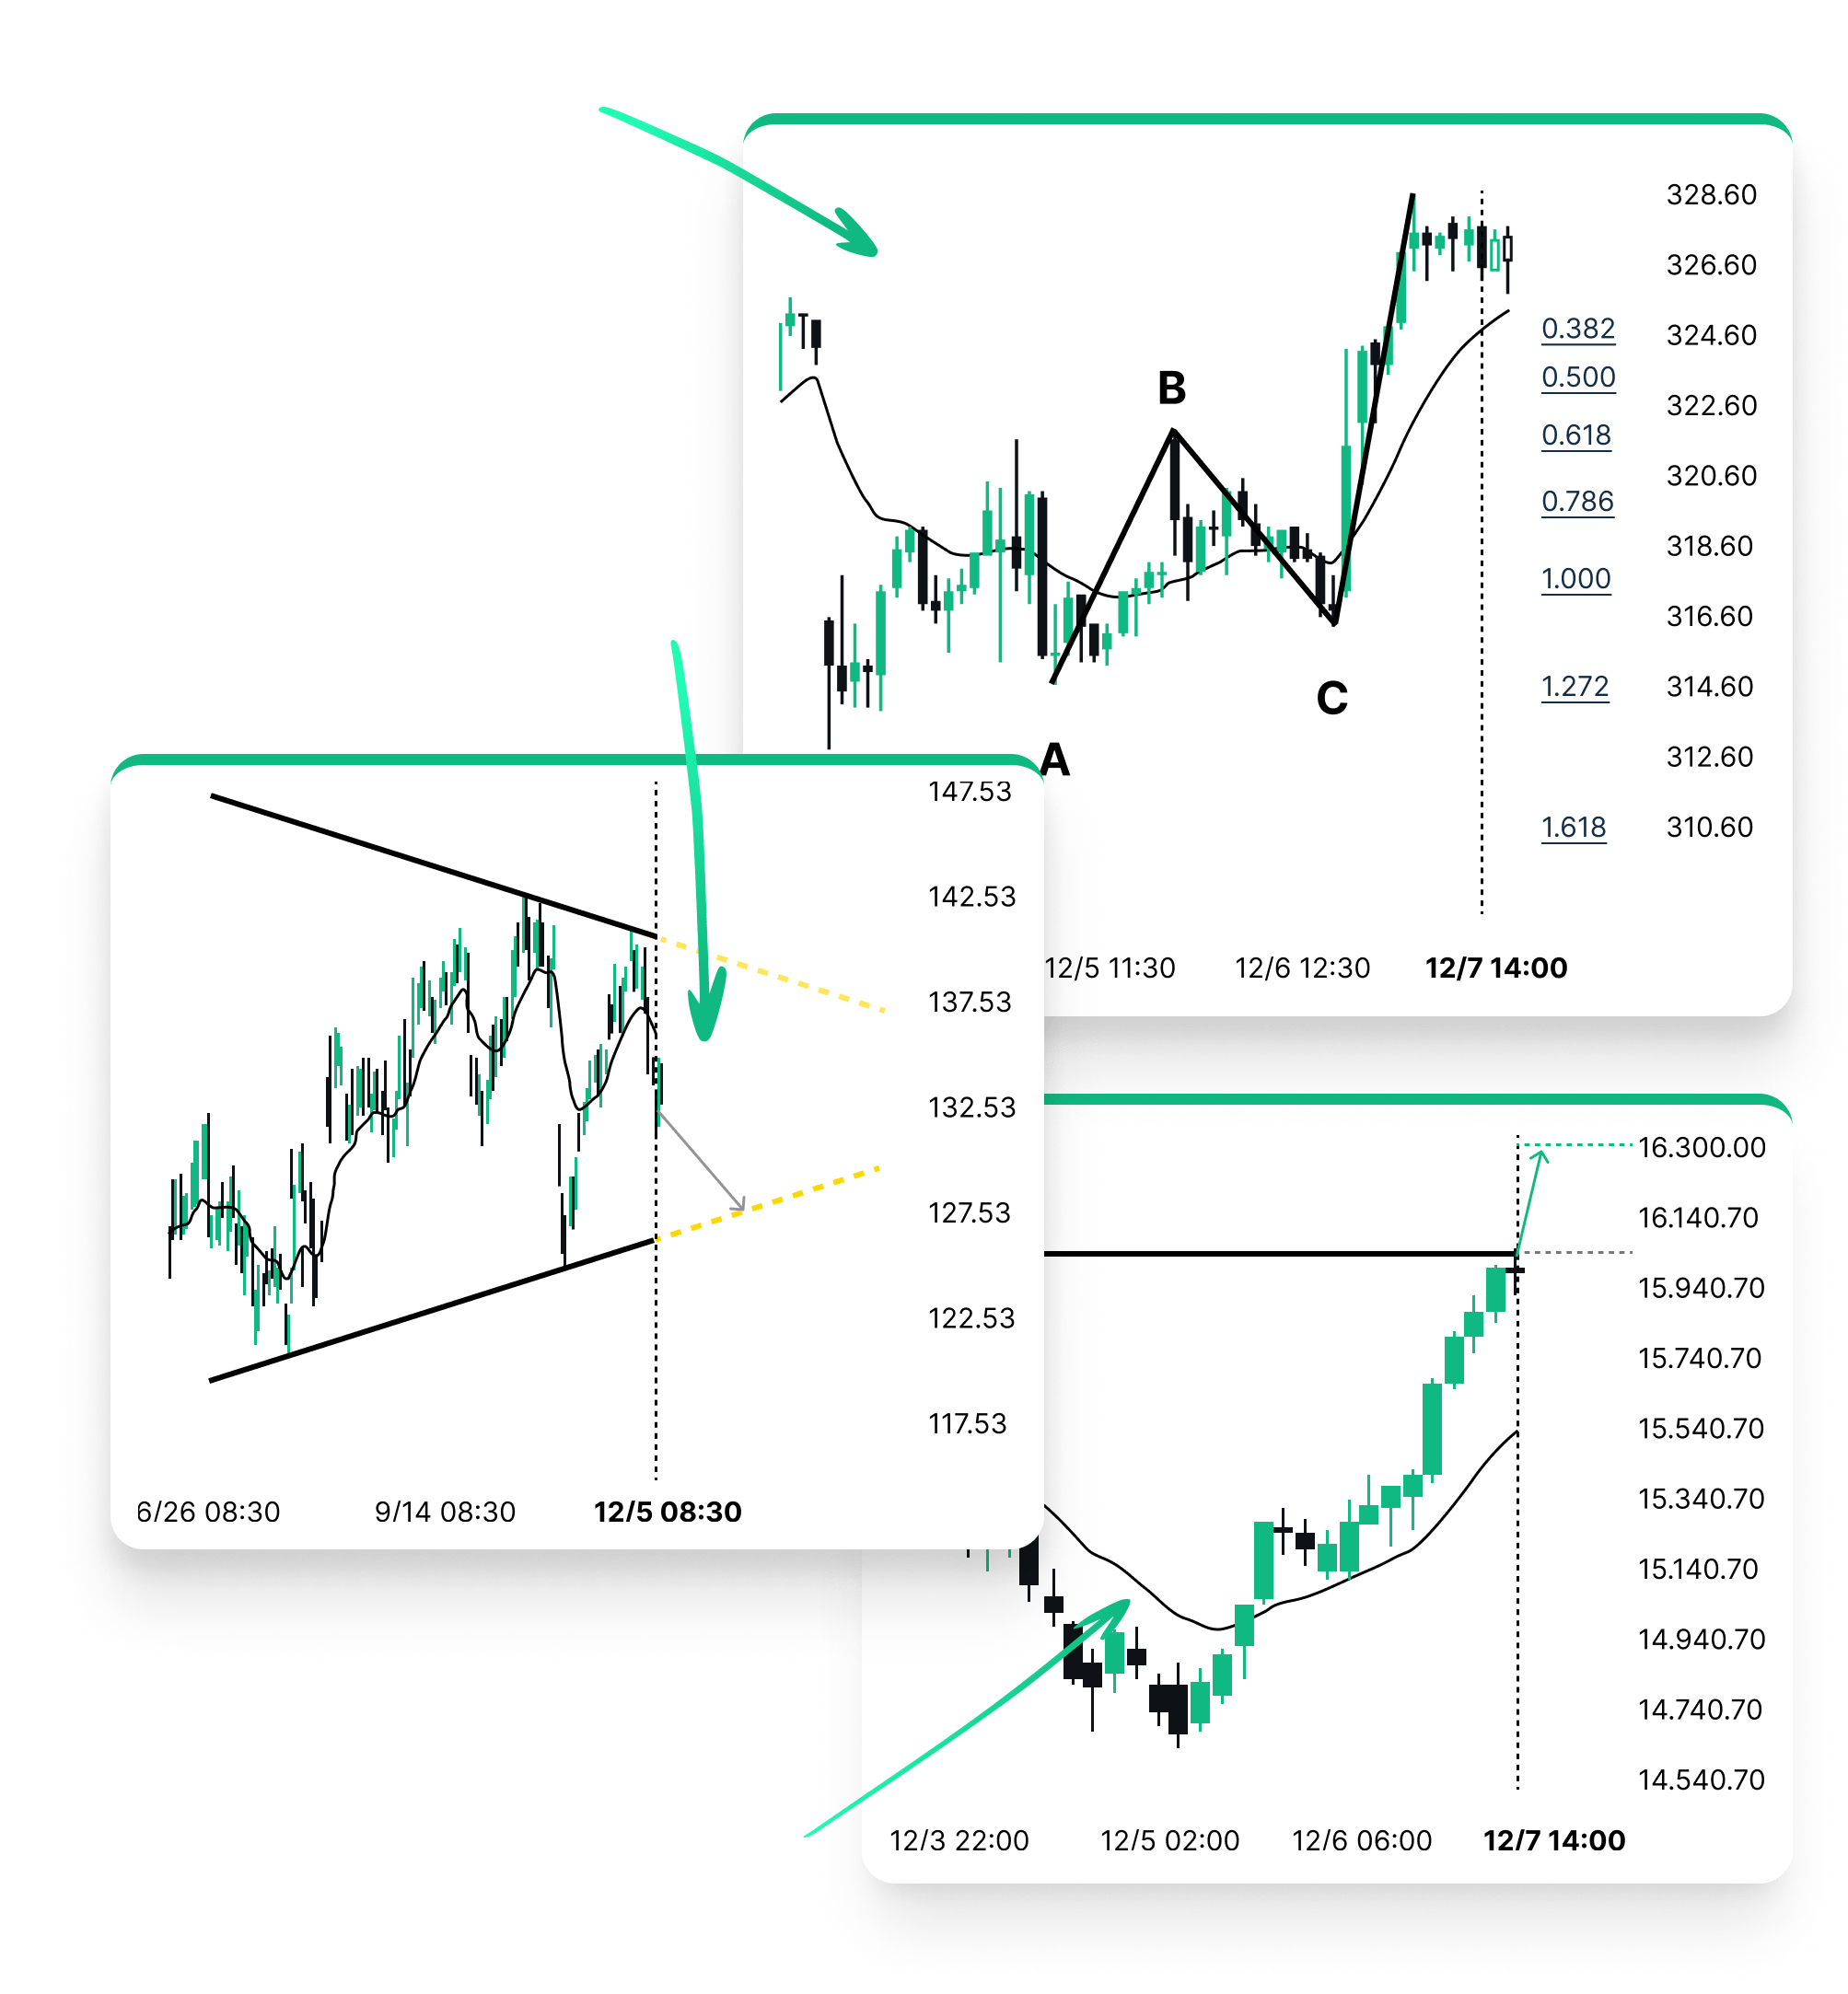
Autochartist provides an extensive analytics toolset with features to take your trading to the next level. Empower your day-to-day trading decisions with an unrivalled breadth and depth of analysis driven by advanced algorithms, powerful big-data technology, and user-friendly trading tools.