All Autochartist's features are delivered to your trading platform via a custom plug-in which links seamlessly to the Autochartist web application bringing you superior scanning ability for the latest trading opportunities.
Step 1: Download the MT4 plugin from the link provided
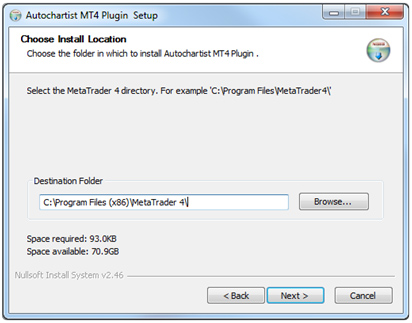
Select your preferred language as shown on the image below:
Select the MetaTrader folder you would like to install the plugin to:
Step 2: In MT4 go to: Tools | Options | Expert Advisors
Step 3: Check “Allow DLL Imports”
Step 4: Do NOT check “Confirm DLL Function Call”
Step 5: Click OK
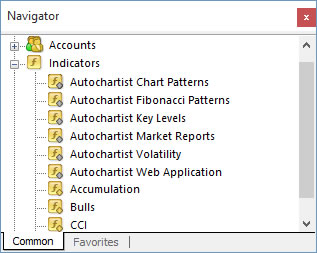
Step 6: In the Navigator window, under Custom Indicators you will see the following:
Step 7: To launch the Autochartist web application drag and drop the Autochartist Web indicator onto the trading platform.
Step 8: To apply one of the indicators above, drag and drop the indicator onto a graph of one of the following time granularities: 15mins; 30mins; 1hr; 4hrs; Daily
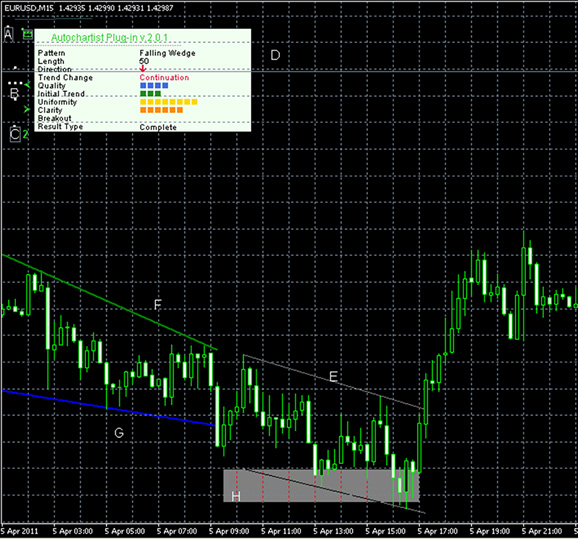
Chart Patterns on MT4:
A: Represents an OBJECT – to move the white block, double-click on the frame and move to a new position. Once a new tick comes through the block will move.
B: <double-click and drag to view older patterns> double click and drag to go a few patterns back
C: 2 – is the Pattern Index with 1 being the newest pattern
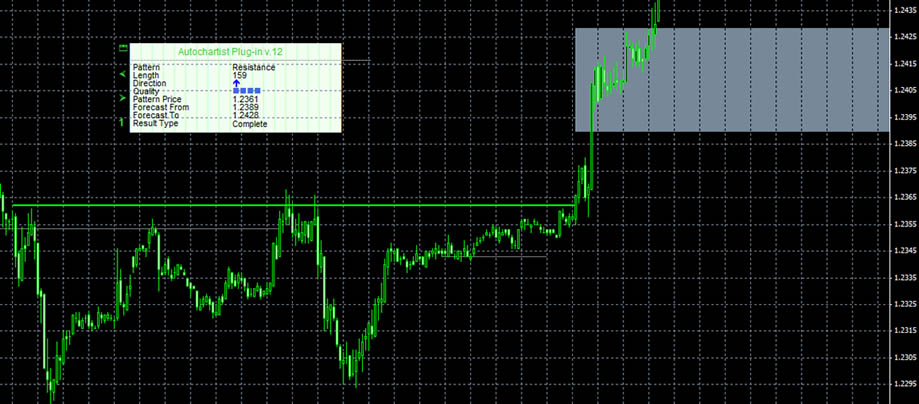
D: Represents the legend with details on the current selected Chart Pattern: Pattern Identified, Length, Direction, Trend Change, Quality, Initial Trend, Uniformity, Clarity, Breakout Strength and Result Type
E: Represents a non-highlighted chart pattern
F: Represents the Resistance level of the currently selected chart pattern
G: Represents the Support level of the currently selected chart pattern
H: Represents the Forecast Zone for the currently selected chart pattern
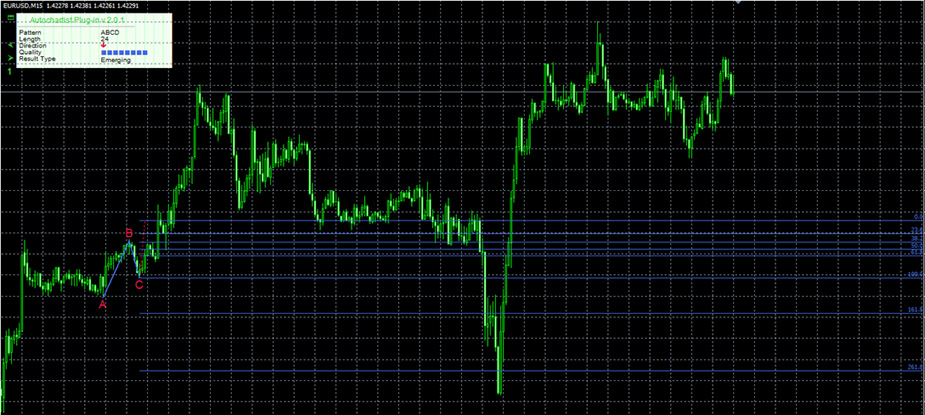
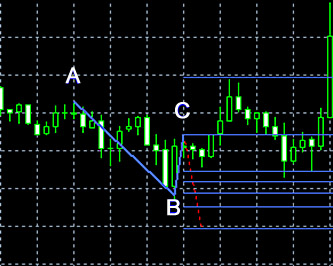
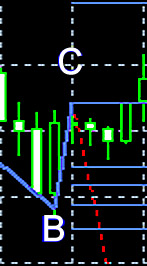
Fibonacci Patterns on MT4:
The screen shot above is an example of a Fibonacci pattern.
Points A, B, C (and D in some patterns) on the image
above indicate the Fibonacci turning points.
The red dotted-line indicates a predicted movement of emerging (only) Fibonacci patterns.
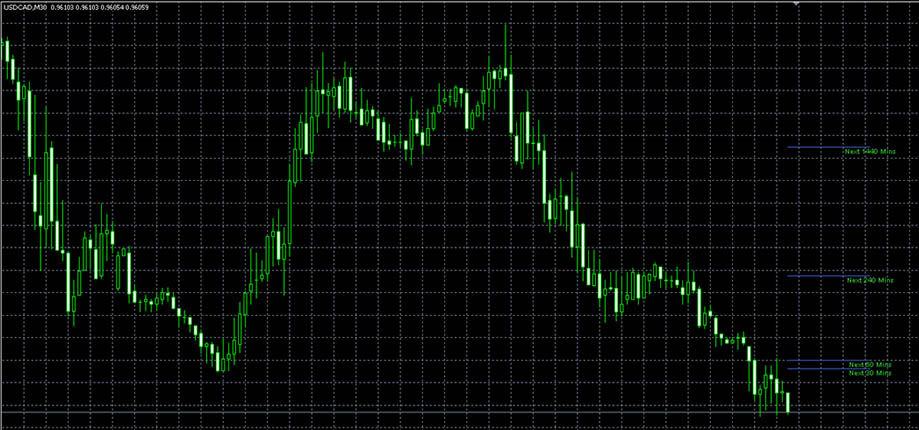
Volatility Analysis on MT4:
The screen shot above is an example of Autochartist's Volatility Analysis feature.
The blue lines on the above image indicate statistical price-movement ranges at the indicated time granularities.
Key Levels on MT4:
The screen shot above is an example of an Autochartist breakout Key Level