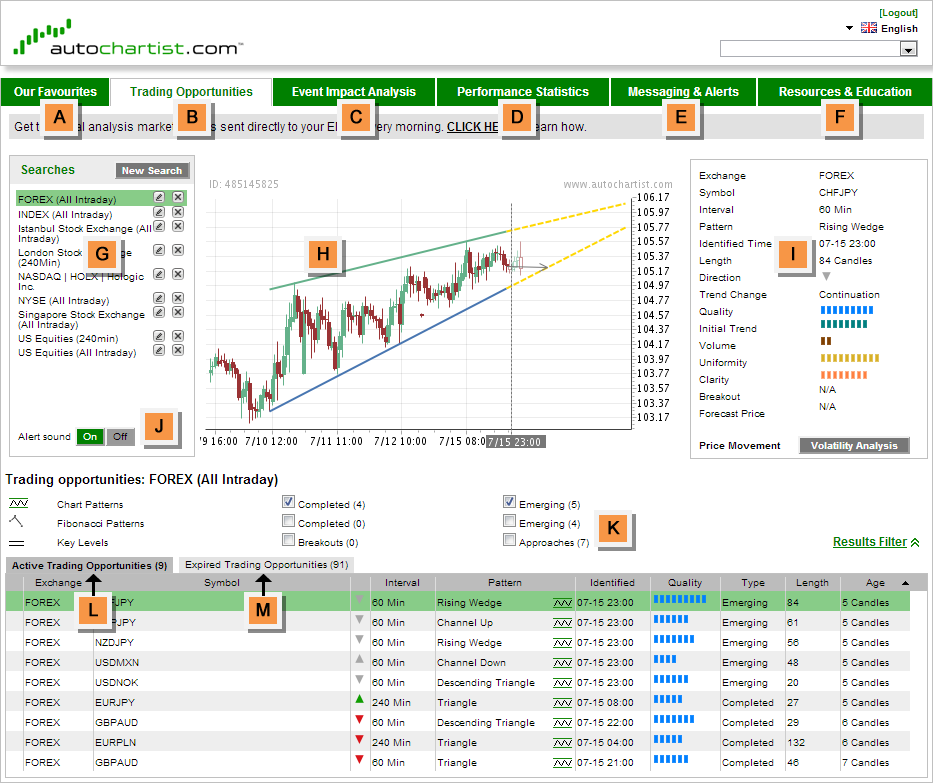
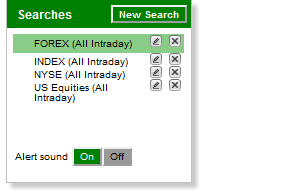
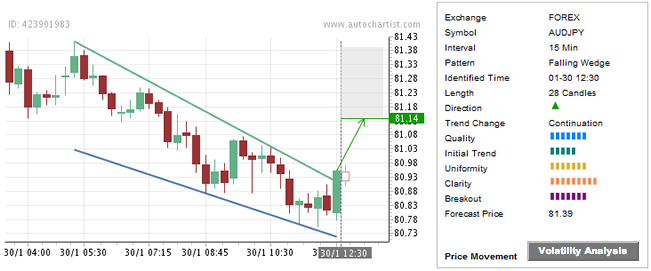
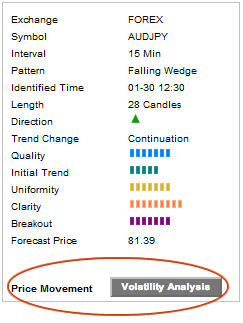
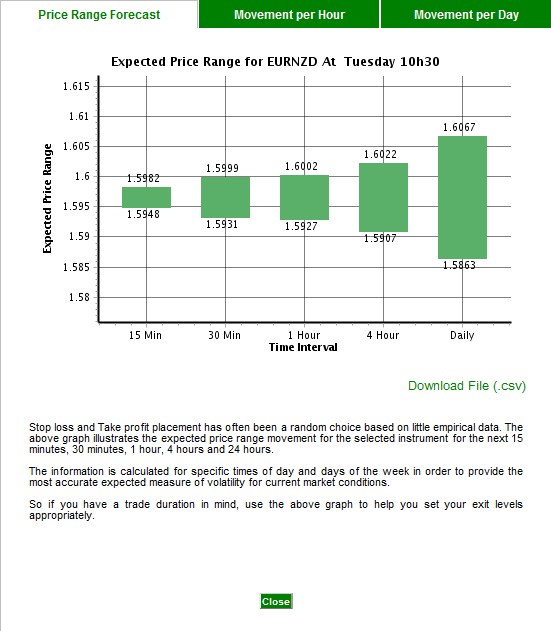
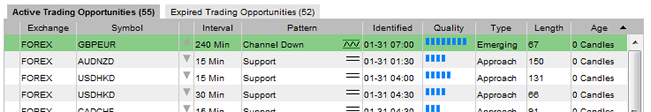
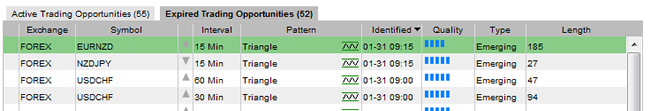
Chapter 2

AUTOCHARTIST WEB INTERFACE

Upon first sign in to the Autochartist web application the interface will display information that has been loaded by default


Our Favourites


Trading Opportunities
- Contains search results for Chart and Fibonacci Patterns, as well as Key Levels

Event Impact Analysis


Performance Statistics


Messaging & Alerts


Trading Community


Search Pane


Pattern Display: click on display to enlarge pattern result


Price Movement Pane: with Quality Indicators and Volatility Analysis


Sound Switch


Results Filter:
Chart Patterns: [Emerging / Complete]
Fibonacci Patterns:[Emerging / Complete]
Key Levels
: [Breakouts / Approaches]

Active Trading Opportunities


Expired Trading Opportunities


Our Favourites

"Our Favourites" is a list of currently active trading opportunities with the highest probability of success based on the last 6 months of identified trading opportunities (Disclaimer: Past performance may not be indicative of future performance). All Autochartist opportunities are evaluated against past performance with respect to the pattern type, the instrument and the time of day it was identified.


Trading Opportunities

Search for Chart Patterns; Fibonacci Patterns, as well as Key Levels trade opportunities from the Trading Opportunities Tab. The Results Filter refines one's preferences by including or excluding some or all of the trade opportunities available.


Event Impact Analysis

This tool provides a concise visual account of the impact previous economic events have had on a particular currency pair. Select the country and news event from the menu on the left, and the effect it had on the selected currency will display on the right.


Performance Statistics

This tab provides detailed statistics on the overall accuracy of Autochartist for the preceding 6-month period, as well as specific statistics on how Autochartist performs on particular symbols, time granularities, patterns and directions. Disclaimer: These statistics are not a measure of profitability, but simply count the quantity of identified opportunities that reach the forecast level within a predefined time.


Messaging & Alerts Tab (Market Reports)

E-mail subscriptions provide one with a report on the technical outlook of the markets for the next few days. Subscribe to receive e-mails up to three times per day for markets such as Forex and Commodities, or once per day for stock exchanges such as the Tokyo Stock Exchange, London Stock Exchange and the New York Stock Exchange.

To subscribe, one should log into the Autochartist platform, click on ‘Messaging & Alerts, select preferred market, select preferred language and the preferred time. Then to receive the email, one should enter an email address and click on submit. . Note: to ensure receipt of Autochartist’s daily e-mail alerts one should please add alerts@autochartist.com to an address book or contact list.


Trading Community

This section provides access to education and product support documentation, as well as downloads and install instructions of Autochartist's MT4; MT5 and JForex plugin. In addition, one can follow live intraday trading using Autochartist. Subscribe to receive e-mail alerts of new trades placed.


Search Pane
When logging in for the first time, the search pane contains a default list of populated searches. Each search contains a set of criteria defined by the individual which specifies which symbols to include in the search. The symbols can be included by:
1. Selecting from predefined groups such as exchanges or instrument types;, or
2. By selecting individual symbols.

The Advanced Search option gives one the ability to choose certain criteria when setting up a search to filter and further refine search results.

When a new trade opportunity is identified this icon  appears next to the search name. By clicking on the  icon one is redirected to the relevant search results.

The information displayed in the Active Trading Opportunities and Expired Trading Opportunities sections (L and M) are from the highlighted search (the search name will be marked in green).

An existing search can be edited by clicking on the pencil icon (), or deleted by clicking on the 'close' icon ().

(Please refer to Chapter 3 “Creating and Editing a Search” for details on creating or editing a search.)


Pattern Display
The price graph in this pane represents the result that was selected in the Active Trading Opportunities. (L)


The following information can be seen on the Pattern Display area (H):

- The date and time at which the pattern was identified is highlighted in grey on the chart.

  • Completed patterns are displayed with a horizontal line representing the forecast level. The colour of the line is representative of the forecast direction of the pattern (green=up and red=down) and is displayed with a directional arrow from the point of breakout to the forecast line.
  • The columns to the right of the price graph contains additional information about the pattern, such as direction, pattern type, identified time, quality (various indicators) and forecast price (completed patterns). For more information see Active Trading Opportunities Pane L.

Price Movement Pane; Quality Indicators and Volatility Analysis

The Volatility Analysis tool provides insight into the movement of instruments. This tool can be used to assess the trading risk associated with different instruments in relation to the time of day in which they are being traded.

To access the Volatility Analysis feature click on the 'Volatility Analysis' button.


A new screen will pop up with 3 tabs:


Price Range Forecast

The Price Range Forecast section is used to get a view of probable ranges that price is likely to move within over different periods/intervals. This allows one to asses the risk of take profit and stop loss levels based on the past six months of price movement data for a particular instrument for the current day of the week at the current time of day.

For advanced users, these ranges are calculated as one standard deviation around the mean of the price movement.


Movement Per Hour

Click to enlargeThe Movement Per Hour view gives an overview of what hours in the day sees more volatility in price movement for a selected instrument.

One can therefore assess the risk associated with trading certain instruments during different times of day.


Movement Per Day


Click to enlargeVery similar to the Movement per Hour view, the Movement per Day view, indicates the weekdays on which more volatility can be expected. This view is aimed at providing information on when certain structural aspects of certain markets make trading on certain days more risky.


Sound Switch

When new results are identified an audible sound is played. . The alert sound can be toggled to On or Off.


The component that Autochartist uses to play sound notifications does an automatic selection of HTML5 audio, native browser audio and Flash (if installed) to play the sound. Flash is most commonly used. To update Flash click on the link: http://get.adobe.com/flashplayer/

Computer sound as well as that of the application must be switched on to receive audio alerts.


Results Filter


Should the results filter not be in view between the Pattern Display and the Trading Opportunities Pane click on the link.

Select preferred types of trade opportunities by using the Results Filter. Tick and/or untick the check boxes next to each type of trade opportunity to view results in the Trading Opportunities Pane. Results will appear or disappear from the Trading OpportunitiesPane in real time as the checkboxes are ticked or un-ticked.


NOTE:
The Results Filter will be applied to any search that is highlighted in the Search Pane (G).


ACTIVE Trading Opportunities

The Active Trading Opportunities section is continuously populated with all the latest results of the search highlighted in the Search Pane (G), that fall within the categories selected in the Results Filter (K).

Active trading opportunities are patterns in which there still can be traded. This means that the price is not moving away from the expected direction and target, and the pattern has not yet completed or reached its target. As soon as any of this changes, the result is moved to the ‘Expired Trading Opportunities’ tab (see below)


By default the first result is selected and highlighted in green.

For the sake of clarity and ease of use, results are highlighted in yellow when the mouse cursor hovers over them. Once clicked the pattern of the selected result will be displayed in the Pattern Display area and the result will be highlighted in green.

Information provided in the Results Pane for Active Trading Opportunities include:

  • Exchange,
  • Symbol,
  • The direction of the pattern,
  • Time interval of the bar chart,
  • The pattern name,
  • The time when the pattern was identified,
  • Overall visual quality assigned to the pattern (arithmetic average of various different visual quality indicators),
  • Pattern length in bars/candles,
  • Age in candles since the pattern was identified.

This list is sorted by Age, which is the number of candles/bars that formed after the pattern was identified. This method of sorting means that longer term patterns such as 1-day and 4-hour patterns will move down the list at a much slower rate than short term patterns (15 min, 30 min). Also, the latest patterns will be listed first.


EXPIRED Trading Opportunities

To view this pane click on the 'Expired Trading Opportunities' tab which will be highlighted in dark grey. This pane lists all expired results for the search highlighted in the Search Pane (K).


A result expires as soon as an event occurs that makes the expected outcome either unlikely or impossible, or when the expectation was fulfilled and the target reached. Some examples of expired opportunities would be when price starts moving consistently away from the target level of a completed pattern, or when an emerging pattern completes (in this case the emerging pattern expires, but a new completed pattern opportunity will arise). See the examples below.

Click to enlarge

The information in this section is displayed in exactly the same way as the information in the Active Trading Opportunities tab. For more information on how results are displayed, please see the preceding section (L).


DISClAIMER: The Autochartist service includes chart pattern identification in respect of foreign currencies, commodities, equities and stocks. There are potential risks relating to investing and trading. You must be aware of such risks and familiarize yourself in regard to such risks and to seek independent advice relating thereto. You should not trade with money that you cannot afford to lose. The Autochartist service and its content should not be construed as a solicitation to invest and/or trade. You should seek independent advice in this regard. Past performance is not indicative of future performance. No representation is being made that any results discussed within the service and its related media content will be achieved. All opinions, news, research, analyses, prices or other information is provided as general market commentary and not as investment advice. Autochartist, MDIO Software, their members, shareholders, employees, agents, representatives and resellers do not warrant the completeness, accuracy or timeliness of the information supplied, and they shall not be liable for any loss or damages, consequential or otherwise, which may arise from the use or reliance of the Autochartist service and its content.

For further support or information please visit www.autochartist.com or e-mail techsupport@autochartist.com