Skip to content
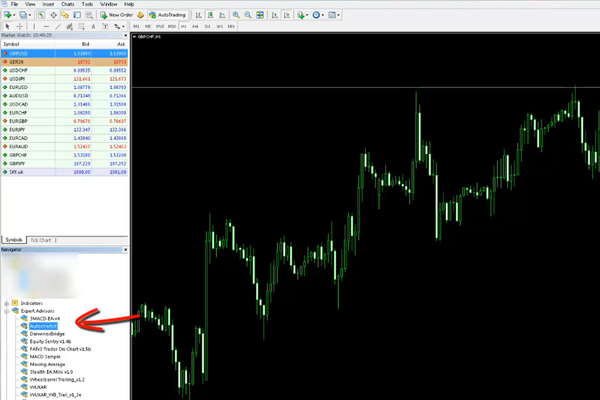
Step 1 – Obtain the installation file and login credentials for the MetaTrader platform, from your broker
Step 2 – Install the MetaTrader platform
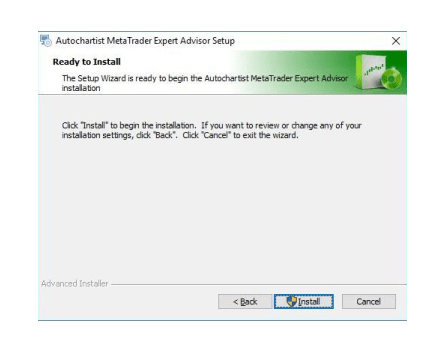
Step 3 – Click install. Then click Finish
Step 4 –
Step 1
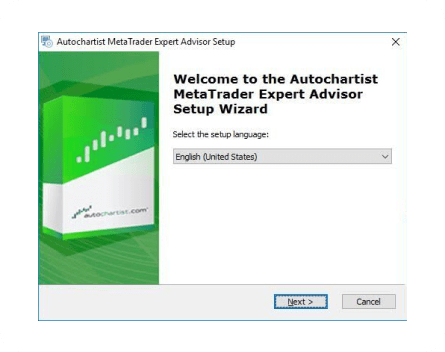
The first window will ask you to select the language you wish to display during the rest of the installation.
Step 2
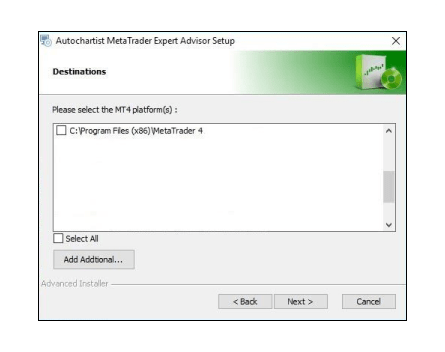
After the welcome and disclaimer windows, the installer will determine all valid installations of MetaTrader and display them in a list. Tick the check box next to each MT4 platform you wish to install this plugin for. if your MetaTrader platform is NOT listed, please see the Trouble Shooting Section
Step 3
Click install. Then click Finish
Step 4
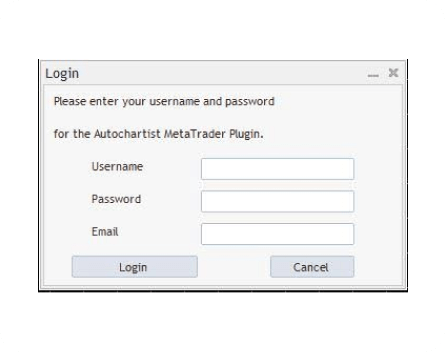
Step 4 – A
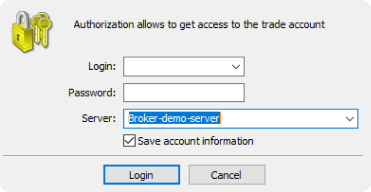
If you are installing the Autochartist MetaTrader Plugin as a Direct User Subscriber, or if your broker requires a username and password login procedure, the first window will ask you for your username, password and email address. Please consult your broker for the username and password (if they require it) or as a Direct user please check the email you received from Autochartist that contains your username and password. Enter your credentials and click Login
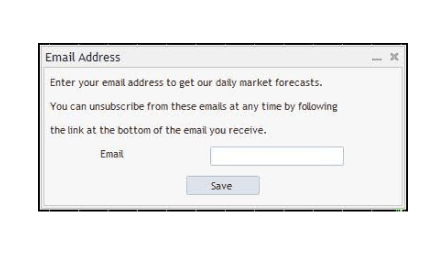
Step 4 – B
If you are installing Autochartist MetaTrader Plugin as a broker-user, enter your email address then click Save
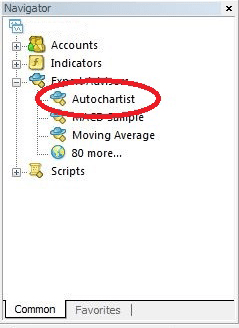
Once your advisor has been installed, you can (re)start your MetaTrader terminal, and it should be listed in the Navigation window, under the Expert Advisor tree-node.
Drag the Expert Advisor onto any chart window.
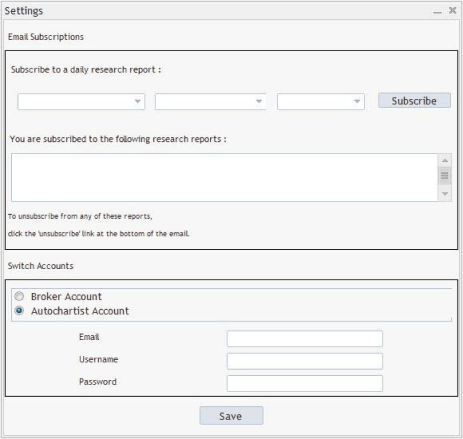
Report subscriptions. Here you can enter an email address, then select the report, the session for which you wish to receive it and the language you wish to receive it in.
After subscribing you will receive an email report once a day for the specific reports, sessions and languages you have selected, about relevant patterns that can be used to enhance your trading strategy. You can subscribe to multiple reports, for multiples sessions in multiple languages.
Change Account. here you can swap between a Broker user account, or a Direct user account, by providing the necessary credentials.
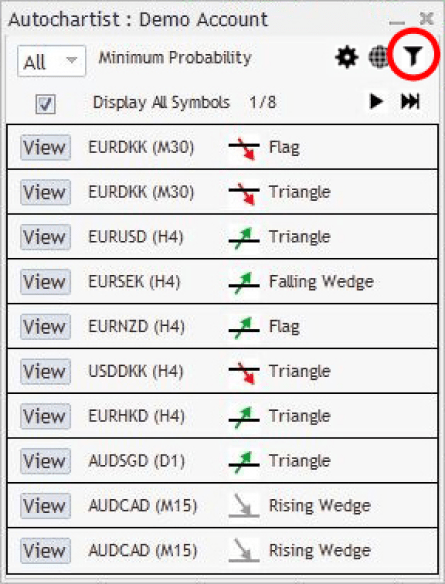
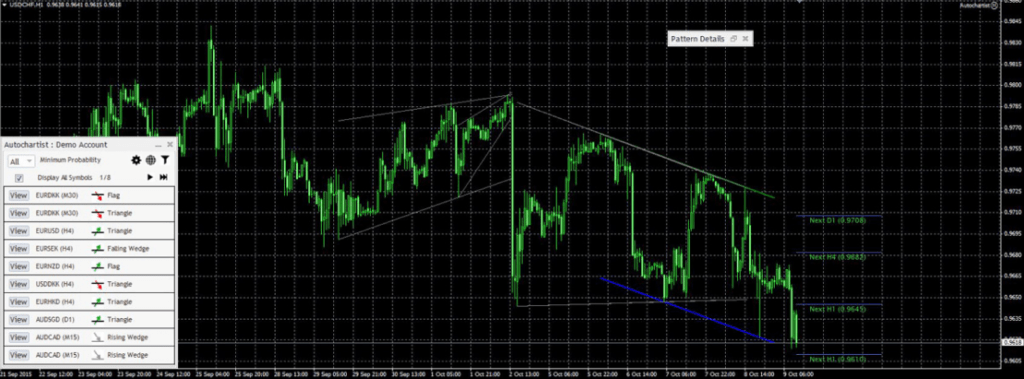
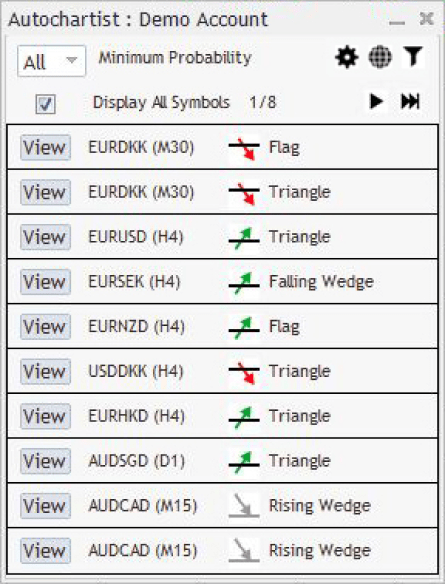
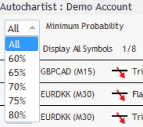
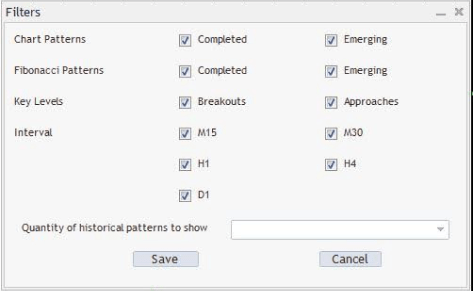
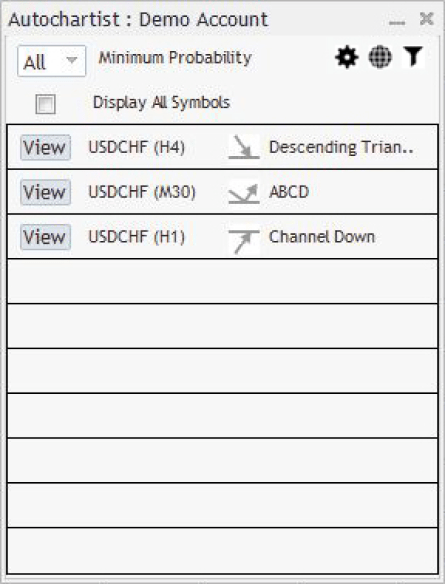
Once clicked a new window will open. In this window you can select the types of patterns you wish to view.
Quantity of historical patterns:
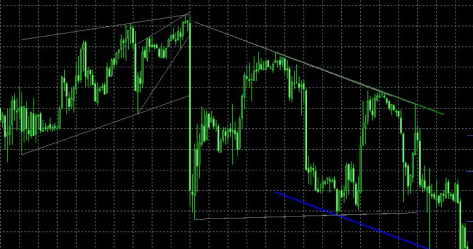
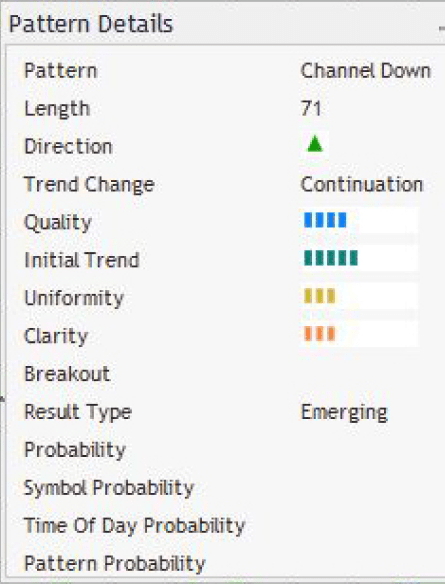
Historical patterns will be displayed on the chart as grey lines. This gives a very basic overview of the direction that the instrument has taken according to the patterns Autochartist has identified in the recent past.
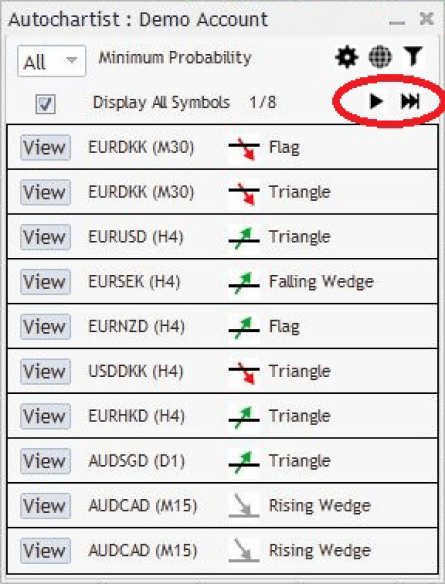
The tick box labelled ‘Display all symbols‘ will display all relevant symbols or instruments that Autochartist has identified for your broker, based upon the “Market Watch” in your terminal.
If this box is unticked, then the Expert Advisor will try to retrieve all patterns for only the symbol of the chart for all periods.
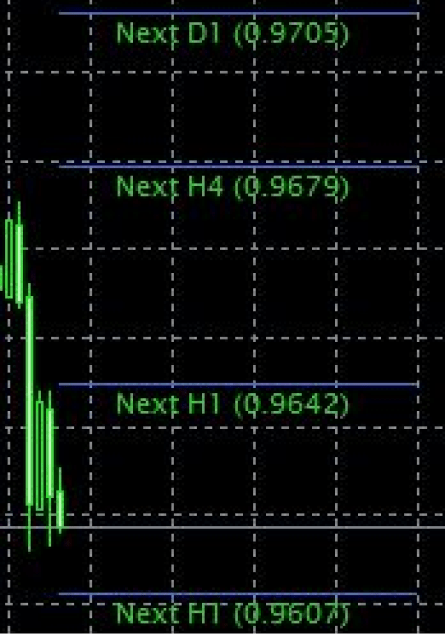
Also displayed on the chart, is the Autochartist Volatility indicator.
This indicator displays statistical analysis of volatility over a period of 6 months, for this specific instrument at this specific time. The volatility indicator will display the averaged maximum price movement for the next 15 minutes, 30, 1 hour, 4 hour and 1 day based on statistical analysis of the last 6 months.
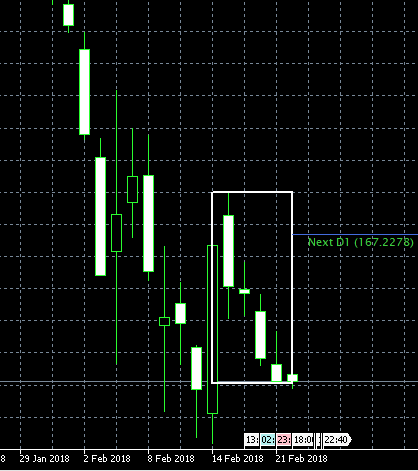
Big Movement
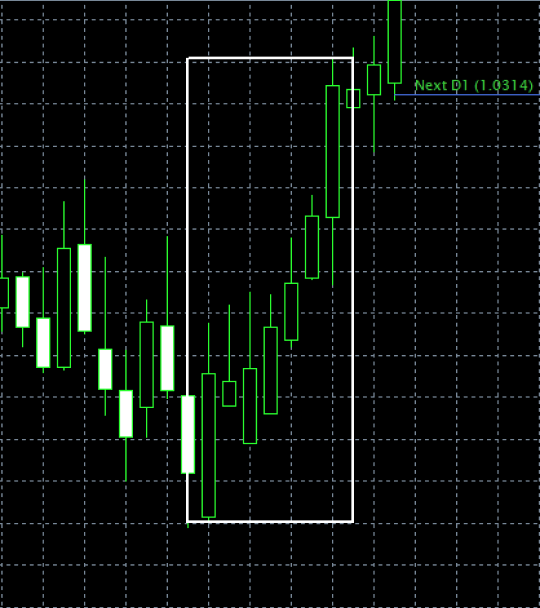
Consecutive Candles
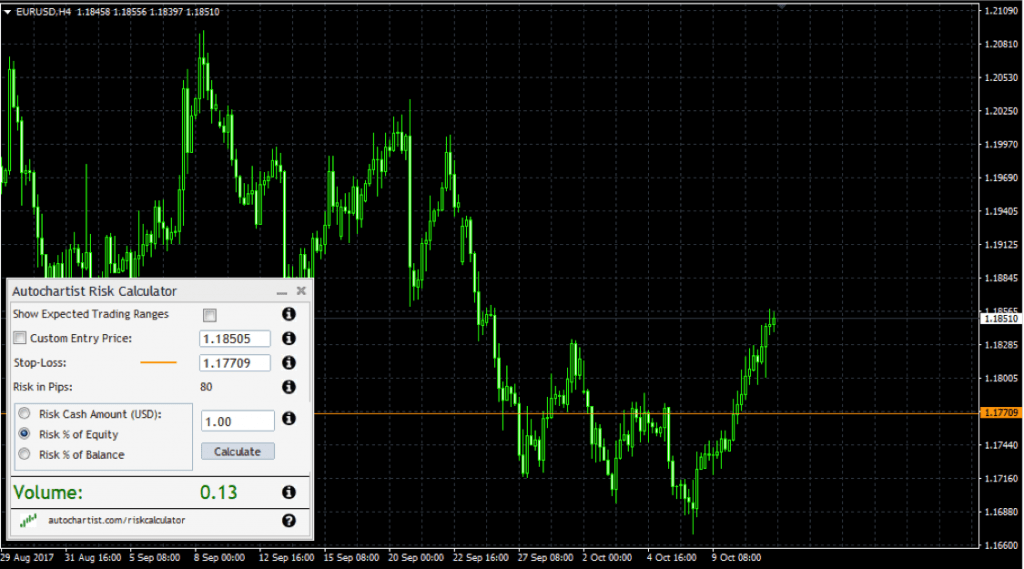
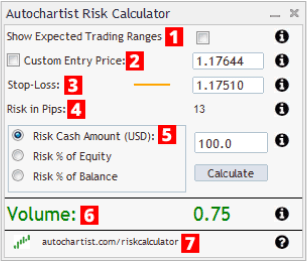
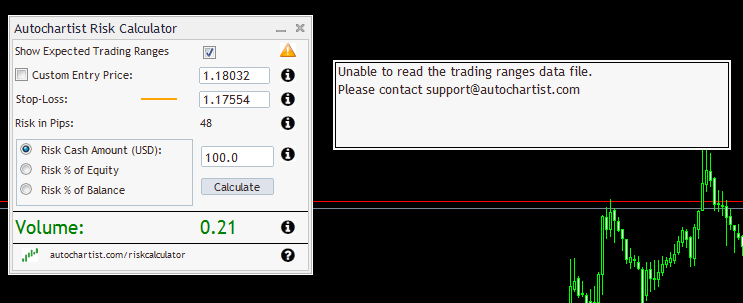
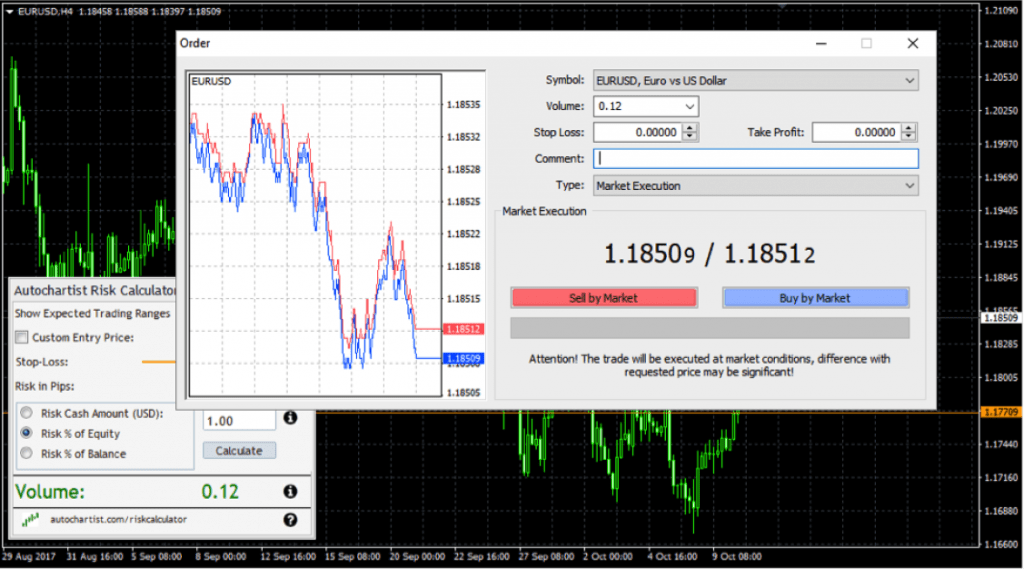
To set the correct trade size when trading the current market price
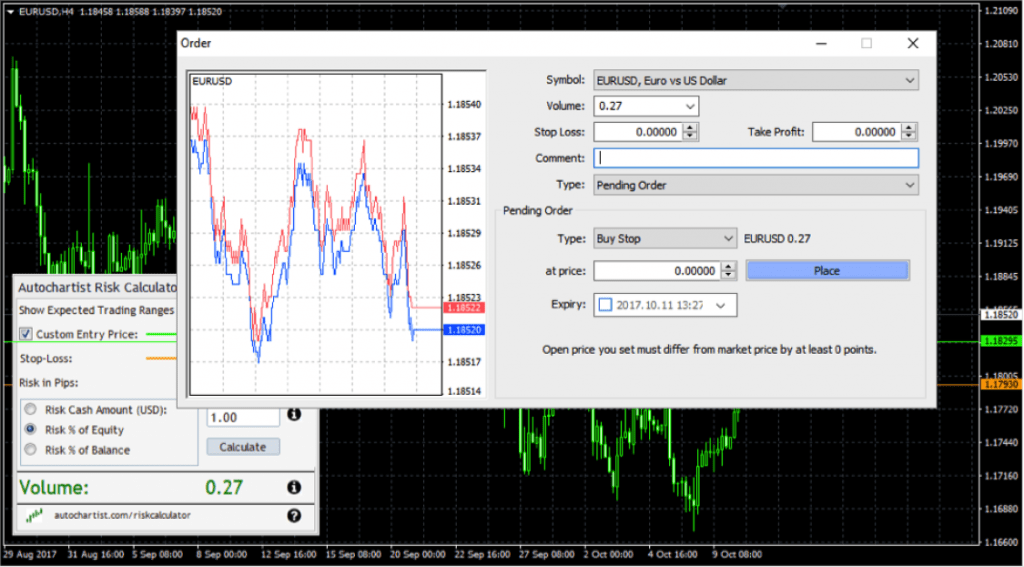
To set the correct trade size when trading pending orders
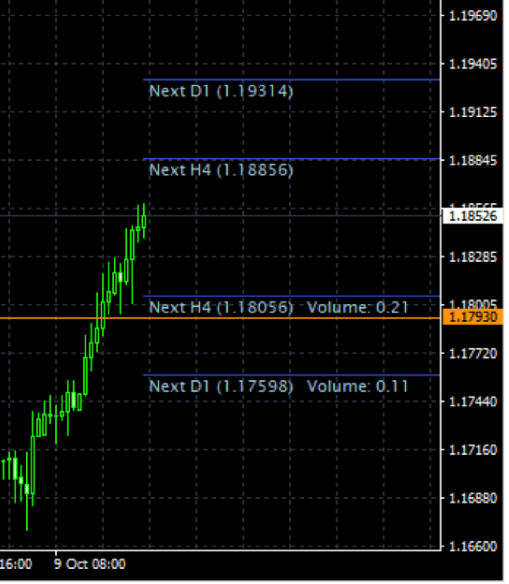
Using Autochartist’s Expected Trading Range as a volatility guide
The Risk Analyzer is also integrated with Autochartist’s Volatility Analysis data. This means that if you tick the “Show Expected Trading Ranges” checkbox, you’ll get the expected trading ranges along with the position sizes for the different levels.
This allows you to not only consider your trading strategy for stop loss levels, but also the expected price volatility. You will notice how the position size is specified on each level. In this example, to risk 1% of my capital with an entry at the current market price and stop loss at 1.17598, we need to set a position size of 0.11.
5.1 Please note: Some Anti-Virus software incorrectly detects our plugin installer as a virus.
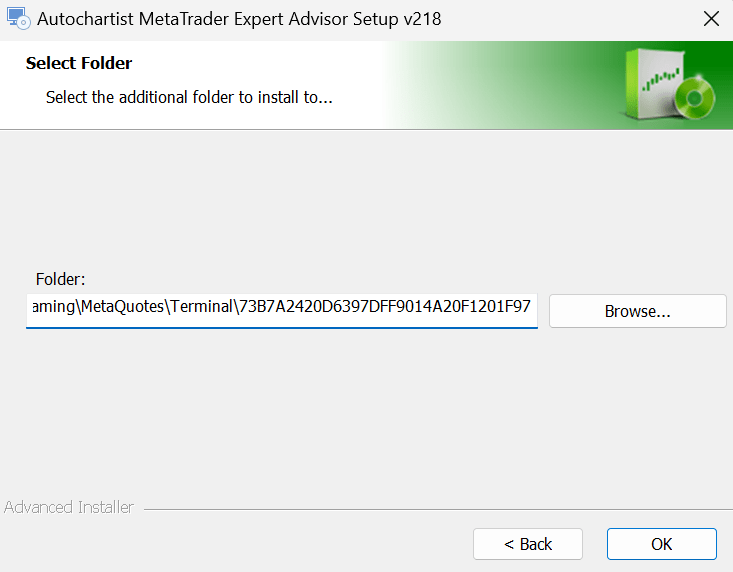
5.2 MT4 Installation – Invalid Destination
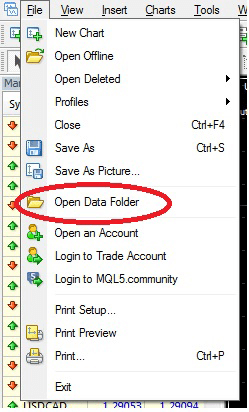
A Windows Explorer window will open up. Click on an open space next to the address bar to highlight the path.
In the Autochartist installer, paste the path in the text box labelled ‘Folder:’, Click Ok.