Chapter 4

EMERGING VS COMPLETE RESULTS

This is a brief overview of emerging patterns, what they mean, and how they become completed patterns.


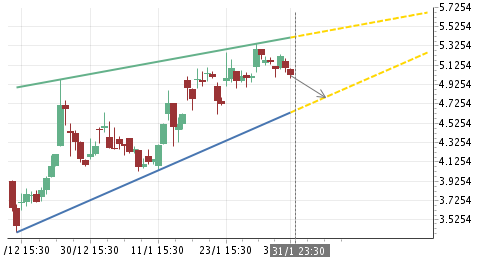
Emerging Chart Patterns:

Emerging Chart Pattern

Emerging chart patterns provides one with early notification of potential trading opportunities. They represent fully formed patterns that only need price to break through support or resistance in order to complete.

As soon as price breaks through the anticipated level of support or resistance, the emerging pattern is expired and a completed pattern presented as a trading opportunity.

Many emerging patterns do not complete however, and this usually means that the price has not continued moving in the direction of support or resistance where the breakout for completion was expected. If a new turning point forms between the support and resistance levels before breaking out, the emerging pattern will expire.

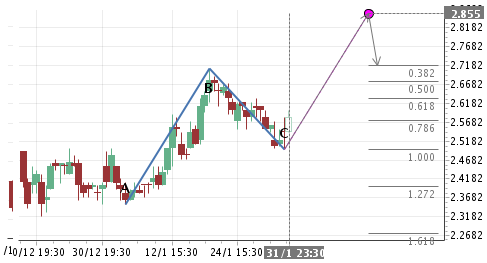
Emerging Fibonacci Patterns:


Emerging Fibonacci patterns are slightly more convoluted, as there is more than one hypothetical condition that needs to occur for the pattern to complete.

The setup for an emerging Fibonacci pattern has a theoretical final turning point set at a particular price level, indicated by a pink dot on the graph. For the pattern to complete, price not only has to reach that level, but it has to find support/resistance at that level and retrace in the opposite direction.

If either the price does not reach the target level, or it does not turn around at that level, the pattern will expire.

DISClAIMER: The Autochartist service includes chart pattern identification in respect of foreign currencies, commodities, equities and stocks. There are potential risks relating to investing and trading. You must be aware of such risks and familiarize yourself in regard to such risks and to seek independent advice relating thereto. You should not trade with money that you cannot afford to lose. The Autochartist service and its content should not be construed as a solicitation to invest and/or trade. You should seek independent advice in this regard. Past performance is not indicative of future performance. No representation is being made that any results discussed within the service and its related media content will be achieved. All opinions, news, research, analyses, prices or other information is provided as general market commentary and not as investment advice. Autochartist, MDIO Software, their members, shareholders, employees, agents, representatives and resellers do not warrant the completeness, accuracy or timeliness of the information supplied, and they shall not be liable for any loss or damages, consequential or otherwise, which may arise from the use or reliance of the Autochartist service and its content.

For further support or information please visit www.autochartist.com or e-mail techsupport@autochartist.com