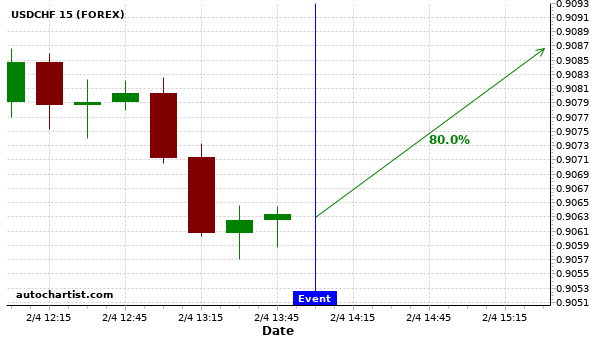
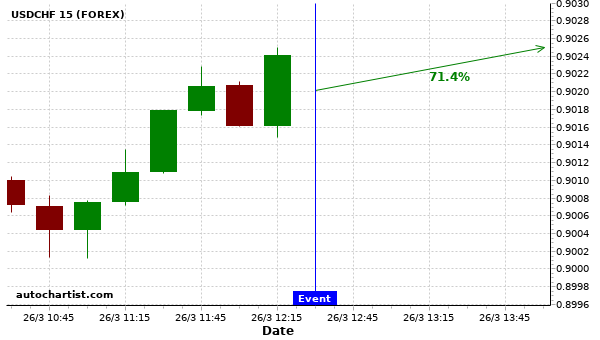
Based on the last 12 JOLTs Job Openings events in United States, we could see USDCHF trend upwards right...
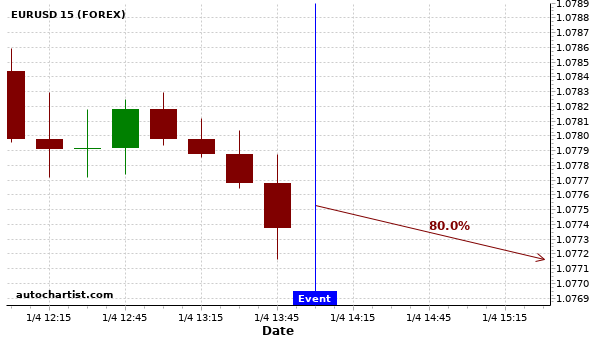
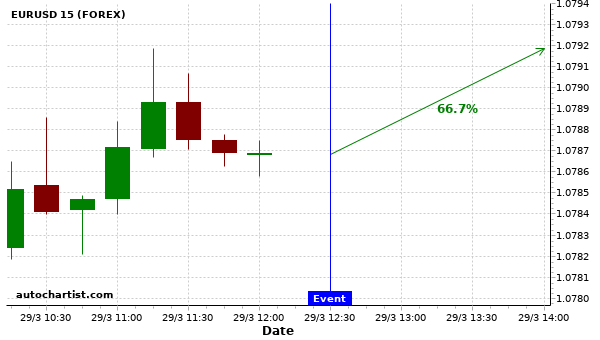
We expect EURUSD to trend downwards for the next 2 hours. Based on these past United States ISM Manufacturing...
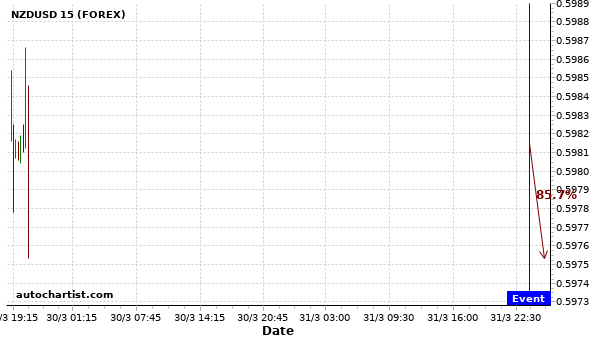
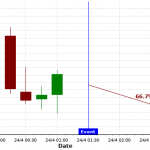
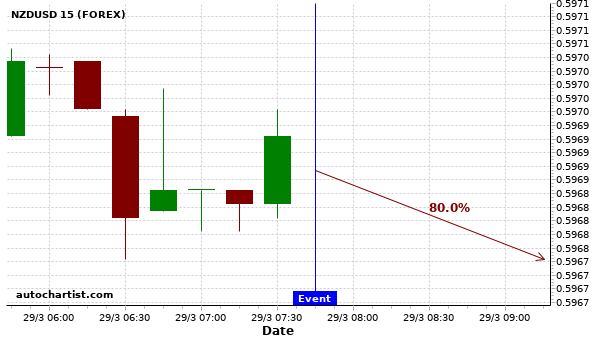
Based on the last 12 Tankan Large Manufacturers Index events in Japan, we may expect NZDUSD to trend downwards...
Based on the last 12 Personal Income MoM events in United States, we could see a $430 movement on...
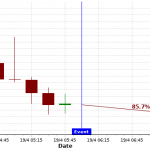
Based on the last 12 Inflation Rate YoY Prel events in France, we could see a $100 movement on...

Based on the last 12 GDP Growth Rate QoQ Final events in United States, USDJPY may trend upwards for...
Based on the last 12 Durable Goods Orders MoM events in United States, we could see a 74 pip...
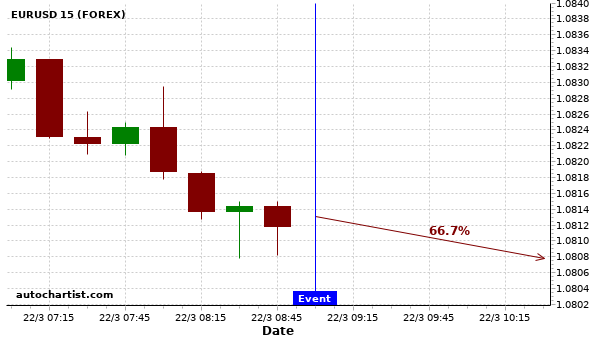
Based on the last 12 Ifo Business Climate events in Germany, EURUSD may trend downwards for the next 2...
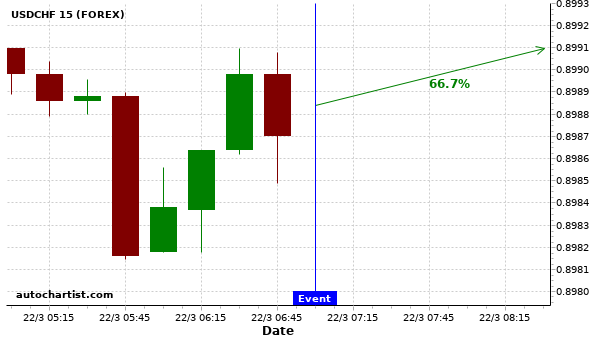
Based on the last 12 Retail Sales MoM events in United Kingdom, USDCHF may trend upwards for the next...
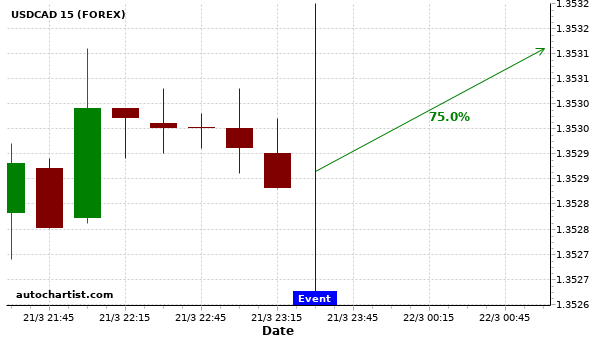
We expect USDCAD to trend upwards for the next 2 hours. Based on these past Japan Inflation Rate YoY...