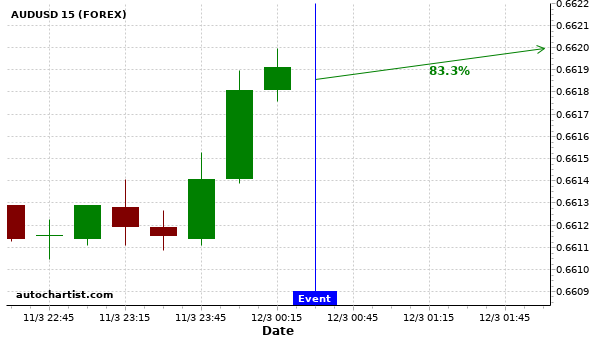
Based on the last 12 NAB Business Confidence events in Australia, we may expect AUDUSD to trend upwards right...
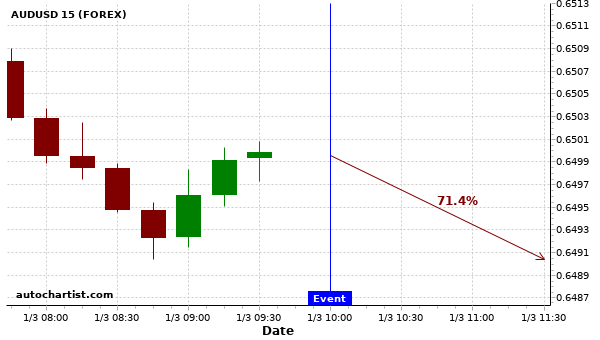
Based on the last 12 Balance of Trade events in Canada, we could see AUDUSD trend downwards right now....
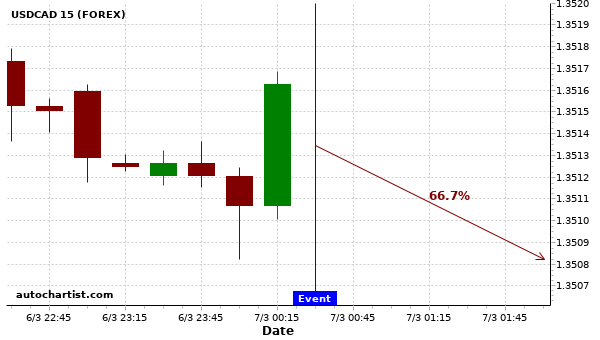
Based on the last 12 Balance of Trade events in Australia, we could see USDCAD trend downwards right now....
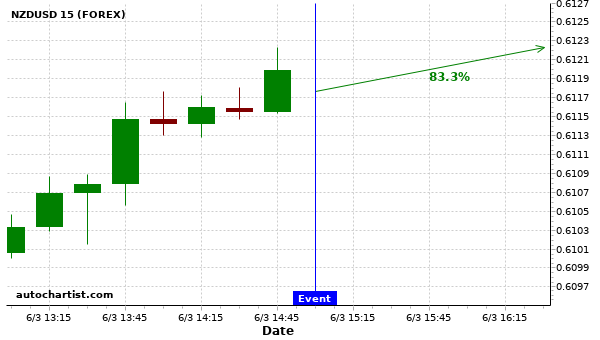
Based on the last 12 Ivey PMI s.a events in Canada, we could see a $220 movement on NZDUSD...
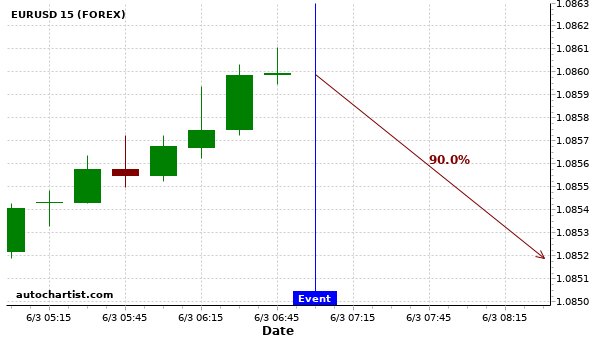
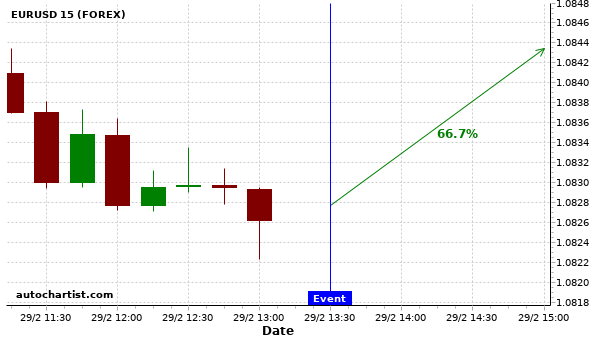
We expect EURUSD to trend downwards for the next 2 hours. Based on these past Germany Balance of Trade...
Based on the last 12 GDP Growth Rate QoQ events in Australia, we could see a $89 movement on...
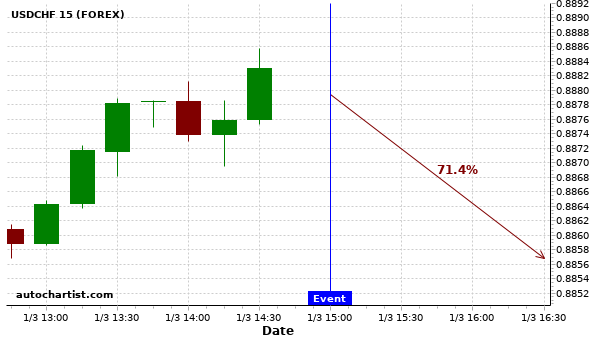
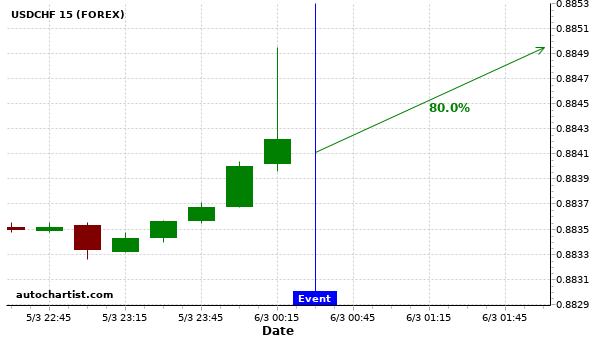
Based on the last 12 ISM Manufacturing PMI events in United States, USDCHF could experience an downwards trend. Based...
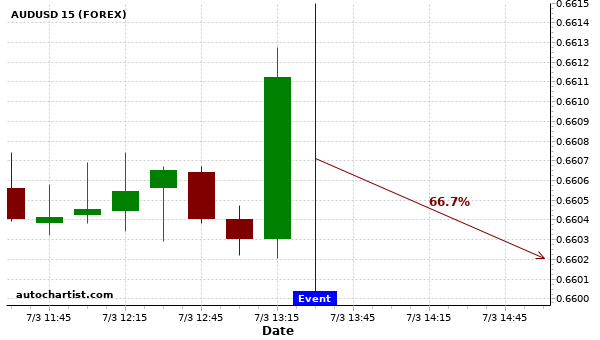
Based on the last 12 Inflation Rate YoY Prel events in Italy, we could see AUDUSD trend downwards right...
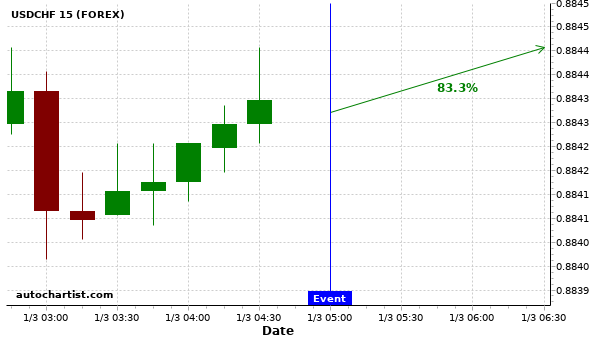
Based on the last 12 Consumer Confidence events in Japan, we could see USDCHF trend upwards right now. Based...
Based on the last 12 GDP Growth Rate QoQ events in Canada, we could see a $240 movement on...