The growing influx of millennials into the financial markets presents a massive opportunity for brokers. It is important not...
1. EURAUD(15 Ελάχ) – Τρίγωνο Αναγνωρισμένος Χρόνος: 2023-01-18 16:15:00 167 pips (1.08%) σε 8.75 ώρες 2. EURCHF(30 Ελάχ) –...
Gen Z, the second generation of digital natives, has already set out on its path to wealth creation, participating...
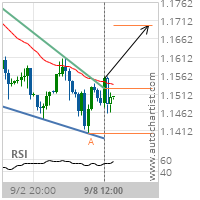
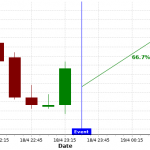
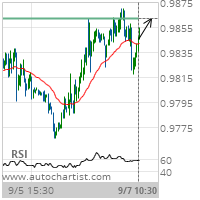
GBP/USD has broken through the resistance line of a Falling Wedge technical chart pattern. Because we have seen it...
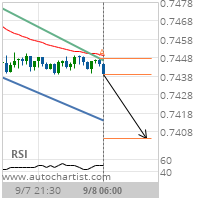
CAD/CHF is approaching the support line of a Channel Down. It has touched this line numerous times in the...
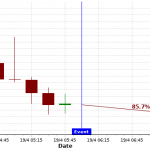
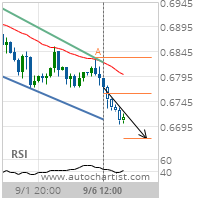
GBP/NZD is heading towards the support line of a Falling Wedge and could reach this point within the next...
USD/CHF is moving towards a resistance line. Because we have seen it retrace from this level in the past,...
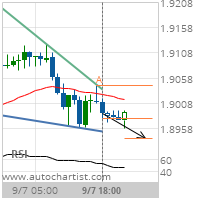
AUD/USD is approaching the support line of a Channel Down. It has touched this line numerous times in the...
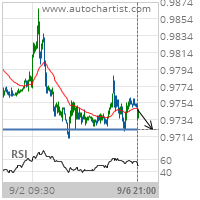
EUR/CHF is heading towards 0.9722 and could reach this point within the next 2 days. It has tested this...

USD/CHF is moving towards a resistance line. Because we have seen it retrace from this line before, we could...