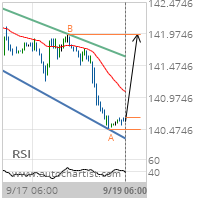

Channel Down identified at 19-Sep-2018 06:00 UTC. This pattern is still in the process of forming. Possible bullish price movement towards the resistance 141.9688 within the next 2 days. Supported by RSI below 40
Chart 1 hour
Pattern Channel Down
Length 102 Candles
Identified 19-Sep-2018 06:00 UTC