By Ilan Azbel, with the help of Jingwei Li.
I have encountered a number of stock, currency and futures broker websites that are promoting what I call “signal grids”; a grid of technical indicators trying to tell traders whether to buy or sell an asset. For example:
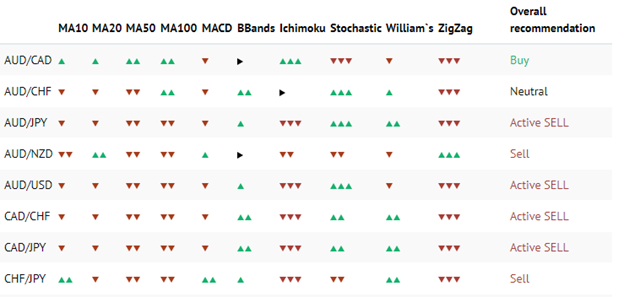
In this grid every column represents a type of technical analysis, for example “MA10” represents a “10 candle moving average”, and the arrows represent the strength of the signal. The last column represents the overall view of all the signals.
On the face of it, this is seemingly an informative overall technical view on each asset, however, these types of signals grids are a sure way for brokers to churn their customers.
Before I explain why, let’s think back to our college days, to STATS101. Well maybe not STATS101, but at most STATS202….
If we want to know whether the “overall recommendation” makes a better prediction than a single indicator we need to define a statistical problem.
We first define three events:
Event A: A indicator says price will go up
Event B: B indicator says price will go up
Event M: price goes up in the market
We assume events A, B and M are independent.
We also know the probability of events A, B and M happening are all 50%.
That is,
P(A) = 0.5
P(B) = 0.5
P(M) = 0.5
(in which “P(A)” means “Probability of A”)
Since events A and M are independent.
P(AM) = P(A)*P(M) = 0.5*0.5 = 0.25
Based on conditional probability:
P(A|M) = P(AM)/P(M) = 0.25/0.5 = 0.5
(in which “P(A|M)” means “Probability of A given M”)
Similarly, we have,
P(B|M) = P(BM)/P(M) = 0.25/0.5 = 0.5
and
P(AB|M) = P(A|M)P(B|M) = 0.5*0.5 = 0.25
Based on Bayes Rule,
P(M|AB) = P(AB|M)*P(M)/P(AB) = 0.25*0.5/0.25 = 0.5
It means when event A and B both happened, that is indicator A and B all forecast that the price will go up, the probability of the market price going up is still 0.5.
This conclusion is logical, we all know that A, B, M are independent, so including more indicators cannot improve the overall probability of success, it is always 50%.
So brokers, STOP MISLEADING YOUR CUSTOMERS!!!!! All you’re doing is increasing customer churn.