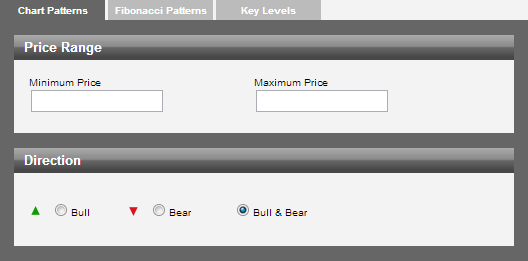
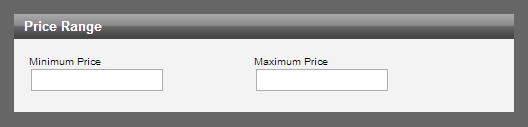
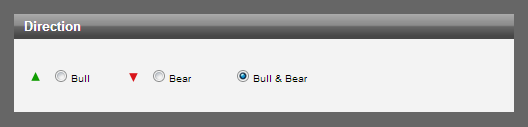
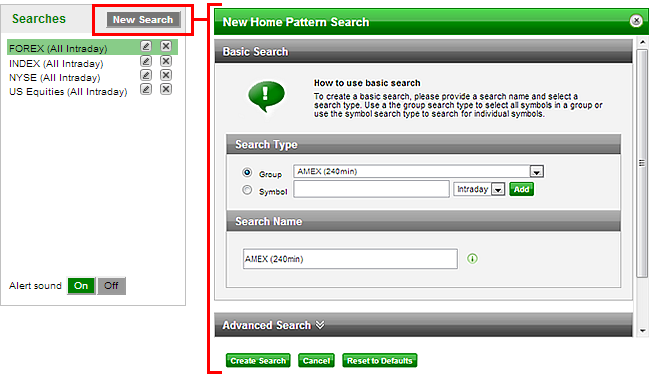
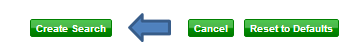
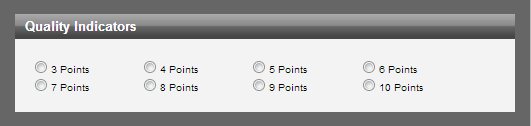
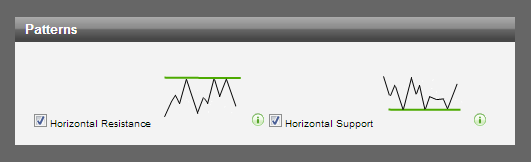
Chapter 3

CREATING AND EDITING A SEARCH

A search is a group of symbols, either predefined or selected by the user, for which the user wishes to find trade opportunities. Each search combines a filter to the symbol selection that filters results based on a set of advanced criteria. These are discussed under Advanced Search Filters below.


To start a new search, click on the ‘New Search’ button at the top of the Search Pane (near the top left corner of the screen). The first step in creating your search is to specify the symbols to which you want to apply the scan.

Basic Search (Selecting symbols/instruments)

The Basic Search functionality is also known as “Grouping”. Here the user can choose between selecting a predefined group (usually symbols on a particular exchange or symbols for a particular time granularity) or selecting symbols individually to form a unique portfolio.


Whenever a new group has been selected, the search name is automatically set to the default name of the group. The search name can be edited or augmented by the user at any time.


To search for specific symbols choose the “Symbol” option on the radio button, add your preferred symbols (start typing in the name of the Forex pair or other symbols and an autocomplete list will appear and update as you type.

Then select the relevant time granularity for each symbol and click on the “Add” button to add the symbol to your custom list.


Note that the search name will automatically change to the latest symbol added each time to your symbol list.

Search Name
The lower part of the search window provides a text field to enter a name for the search. It changes automatically to the last group that was selected, or the last symbol that was added to a custom list. It should always be given a meaningful name, just as you would give a descriptive file name to an important document when saving it. The name of the search will be displayed in the Search Pane.

The last step in the process of creating a basic search is to click the “Create Search” button at the bottom of the popup window.


Advanced Search Filters

To create an “Advanced Search” filter on a new or existing search, select the “Advanced Search” link at the bottom of the basic search options.


The Advanced Search screen will expand with a list of additional criteria to refine your search. You will note three separate tabs for Chart Patterns, Fibonacci Patterns and Key Levels. Each tab displays specific criteria that will refine the search for the selected category of pattern or key level.

The selected tab is displayed in a lighter grey, and all the filter criteria relevant to that analysis type can be changed below.


NOTE: Beware not to make the advanced filter criteria too restrictive. It can easily happen that two or three criteria can be made too restrictive and cause the search to end up with an empty result set. Whenever you see the message “No Patterns Found” in the Results Pane, make sure that you search results are not too restrictive.

Each set of search criteria will be discussed in separate sections below.


Advanced Filters: Chart Patterns

Price Range

This functionality is mainly useful for scanning Equities and CFD.s. The user can define a minimum to maximum price range in the text boxes provided, for example to limit penny stocks or very expensive equities.

Direction

Search results can be filtered according to the direction of the expected outcome of price movement after the pattern is identified. Every pattern has either a bullish or bearish outlook. If you are interested only in a particular market direction you can select it here by clicking the applicable radio button.

Trend Change

The expected price movement after a chart pattern is found would either be in the same direction as the Initial Trend, or in the opposite direction. If the expected price movement after the pattern follows the same direction as the Initial Trend it is known as a continuation pattern. However, if it goes in the opposite direction to the Initial Trend it is called a reversal pattern.

Depending on the type of market stage (trending or sideways) you may be more interested in either continuation or reversal patterns. Here you can filter these patterns according to your preference by clicking on the applicable radio button.

Minimum Pattern Length


Pattern length is determined by the number of candles (bars) of the price chart that are contained in the pattern. For example, a pattern length of 30 on a graph with 60 minute bars would mean that the pattern was formed over 30 hours.

Longer patterns tend to be of better quality, so you can choose to filter out short patterns by setting the minimum pattern length by using the slider.

Chart Pattern Quality Indicators

Autochartist automatically rates 5 objective indicators to measure Chart pattern quality: Clarity; Initial Trend; Volume; Uniformity and Breakout strength.

Quality indicators reflect the visual appeal of the pattern. A high quality pattern will naturally appear more attractive, well-proportioned and symmetrical. The overall quality measure is the arithmetic average of all other indicators.

Quality is expressed as a number ranging from 0 to 10, where 10 is the best quality and 0 is the poorest. Use the sliders to set the required levels of pattern quality for your search (see image below).


It is important to remember that the settings in this section determine the minimum requirements for quality. A lower threshold would allow more patterns to pass the search criteria. If the requirements are set too high, your search may return very few results or none at all. If all the quality indicator filters are set to zero, no results will be filtered out on quality and all results will be returned.

Overview of Chart Pattern Quality Indicators:

Clarity:
Indicates the level of “noise” in the price graph. If there are many spikes in the price movements the clarity will be low.

Initial Trend:
The strength of the trend that precedes a pattern is a very good measure of the visual quality of the pattern. A long, consistent Initial Trend will have a higher rating for this indicator.

Volume:
An important indicator to measure the worth of a market move. If the markets have made strong price moves either up or down. The perceived strength of that move depends on the Volume for that period. The higher the Volume during that price move the more significant the move. Volume is only applicable to exchange-traded instruments (equities, ETFs).

Uniformity:
If the points touching the support and resistance lines are more evenly spaced over time, the pattern will have a better Uniformity rating.

Breakout Strength:
 The momentum with which the price breaks through support or resistance indicates the significance of the breach of the previous psychological level. Stronger Breakout is a reinforcement of the underlying theory, and signals a better chance of reaching the forecast region.

Types of Chart Patterns

There are 16 different types of chart patterns that Autochartist identifies. Any of these can be filtered out in the Advanced Filter section of a search. For descriptions of each of these patterns, click on the  icon next to the pattern.


Advanced Filters: Fibonacci Patterns

Price Range

This functionality is mainly useful for scanning Equities and CFD’s. The user can define a minimum to maximum price range in the text boxes provided, for example to limit penny stocks or very expensive equities.

Direction


Search results can be filtered according to the direction of the expected outcome of price movement after the pattern is identified. Every pattern has either a bullish or bearish outlook. If you are interested only in a particular market direction you can select it here by clicking the applicable radio button.

Minimum Pattern Length


Pattern length is determined by the number of candles (bars) of the price chart that are contained in the pattern. For example, a pattern length of 30 on a graph with 60 minute bars would mean that the pattern was formed over 30 hours.

Longer patterns tend to be of better quality, so you can choose to filter out short patterns by setting the minimum pattern length by using the slider.

Fibonacci Pattern Quality Indicators:

Three objective indicators measure Fibonacci pattern quality. Each Indicator is discussed below.
Quality indicators reflect the visual appeal of the pattern. A high quality pattern will naturally appear more attractive, well-proportioned and symmetrical. The overall quality measure is the arithmetic average of all other indicators.

Quality is expressed as a number ranging from 0 to 10, where 10 is the best quality and 0 is the poorest. Use the sliders to set the required levels of pattern quality for your search (see image below).


Clarity
Indicates the level of “noise” in the price graph. If there are many spikey movements in the price movements the clarity will be low.

Time Symmetry

The degree to which time differences between turning points follow the same Fibonacci ratios found in price levels.

Price Symmetry

Price Symmetry is the degree to which the identified ratios match the theoretical Fibonacci ratios, within some margin of error. Therefore, the smaller the margin of error, the higher the Price Symmetry.

Fibonacci Pattern Types
There are six different types of Fibonacci patterns identified by Autochartist. Any of these can be filtered out in the Advanced Filter section of a search. For descriptions of each of these patterns, click on the icon next to the pattern.


Advanced Filters: Key Levels

Chart patterns, Fibonacci Patterns and Key Levels are accompanied by their own set of unique search criteria.  Each section is described below.

Price Range


This functionality is mainly useful for scanning Equities and CFD’s. The user can define a minimum to maximum price range in the text boxes provided, for example to limit penny stocks or very expensive equities.

Minimum Pattern Length

Pattern length is determined by the number of candles (bars) of the price chart that are contained in the pattern. For example, a pattern length of 30 on a graph with 60 minute bars would mean that the pattern was formed over 30 hours.

Longer patterns tend to be of better quality, so you can choose to filter out short patterns by setting the minimum pattern length by using the slider.

Quality Indicators

Key Levels have a single indicator that shows the significance of the Key Level. This is a measure of the number of points where the price graph touches the support or resistance level and thus confirms it. More touching points mean there is more evidence that this level of support or resistance is significant and that if it is breached, we can expect strong price momentum.


By default any Key Level will have at least 3 touching points, but this set of radio buttons allows the user to specify higher minimum number of touching points to filter on. Note that the higher number this filter is set to, the fewer results will be displayed, although they will generally be of a better quality.

Key Level Pattern Types

There are only two types of Key Levels – Support Resistance. Horizontal Support is a low price level that is tested and touched from above, while Horizontal Resistance is a price ceiling that is touched from below and broken through in a bullish direction.


DISClAIMER: The Autochartist service includes chart pattern identification in respect of foreign currencies, commodities, equities and stocks. There are potential risks relating to investing and trading. You must be aware of such risks and familiarize yourself in regard to such risks and to seek independent advice relating thereto. You should not trade with money that you cannot afford to lose. The Autochartist service and its content should not be construed as a solicitation to invest and/or trade. You should seek independent advice in this regard. Past performance is not indicative of future performance. No representation is being made that any results discussed within the service and its related media content will be achieved. All opinions, news, research, analyses, prices or other information is provided as general market commentary and not as investment advice. Autochartist, MDIO Software, their members, shareholders, employees, agents, representatives and resellers do not warrant the completeness, accuracy or timeliness of the information supplied, and they shall not be liable for any loss or damages, consequential or otherwise, which may arise from the use or reliance of the Autochartist service and its content.

For further support or information please visit www.autochartist.com or e-mail techsupport@autochartist.com