
Technical Analysis Market Scanner
A powerful trading tool that scans the global financial markets and provides near real-time, accurate, and detailed market insights into thousands of technical trade setups across multiple asset classes.
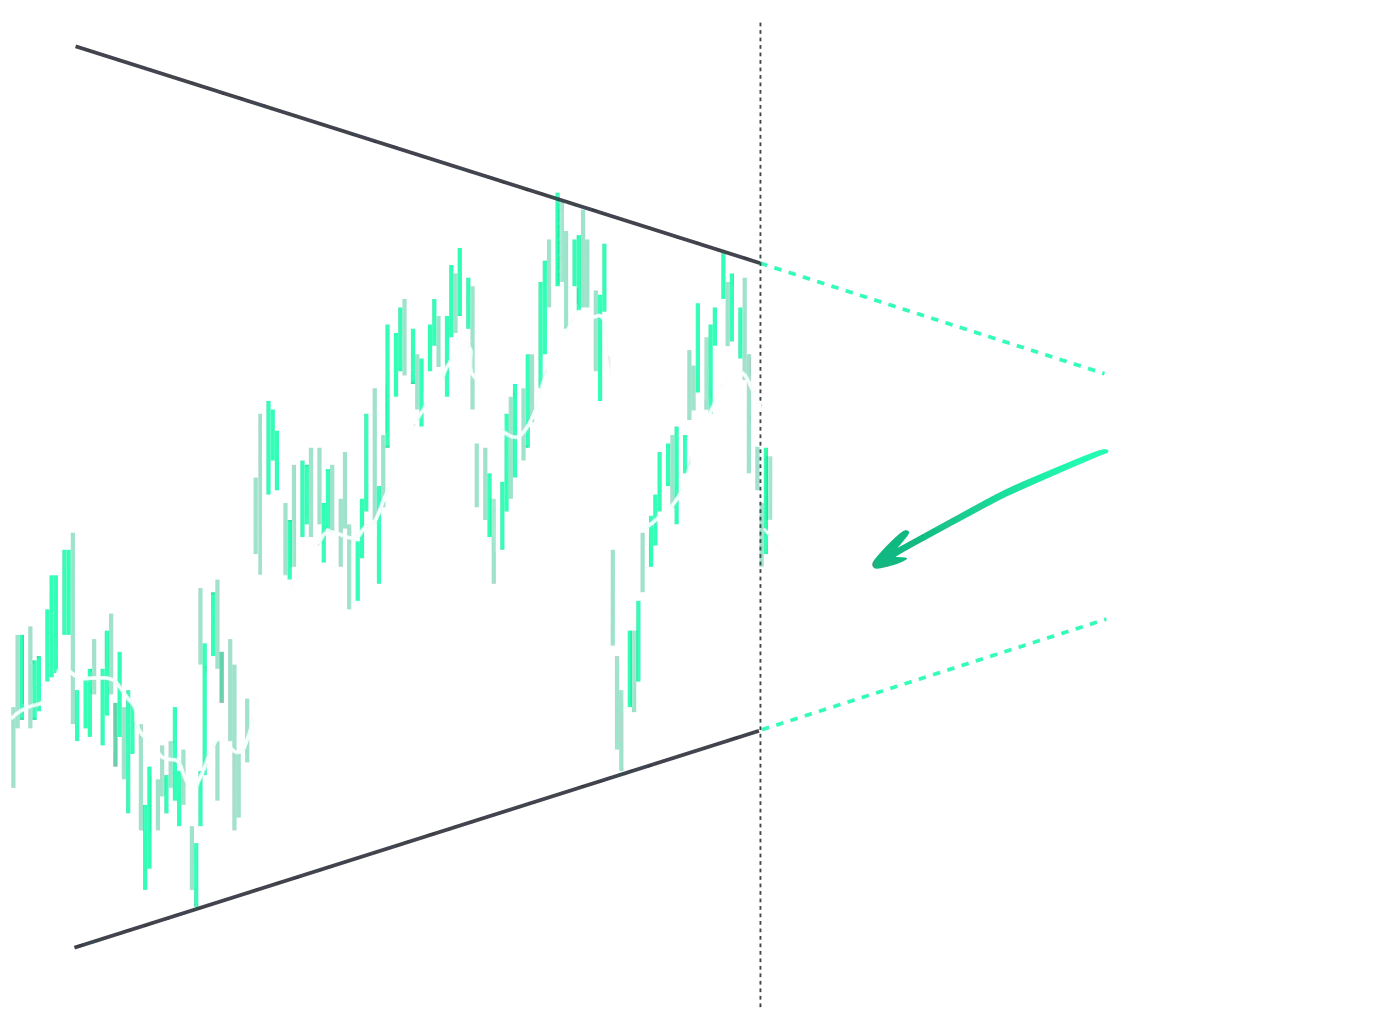
Technical Analysis
These trade setups are ideal for traders keen on catching market trends and reversals early. Harnessing the power of extensive data analysis, this popular component is widely considered one of the best technical analysis tools available. It provides these insights in both “breakout” and “emerging” forms, allowing traders to adapt swiftly to market changes. Using advanced algorithms, it automatically detects potential trade setups, identifying Chart Patterns, Key Levels, Fibonacci Patterns, Horizontal support and resistance levels, and significant market movements at a rate far surpassing human capabilities.
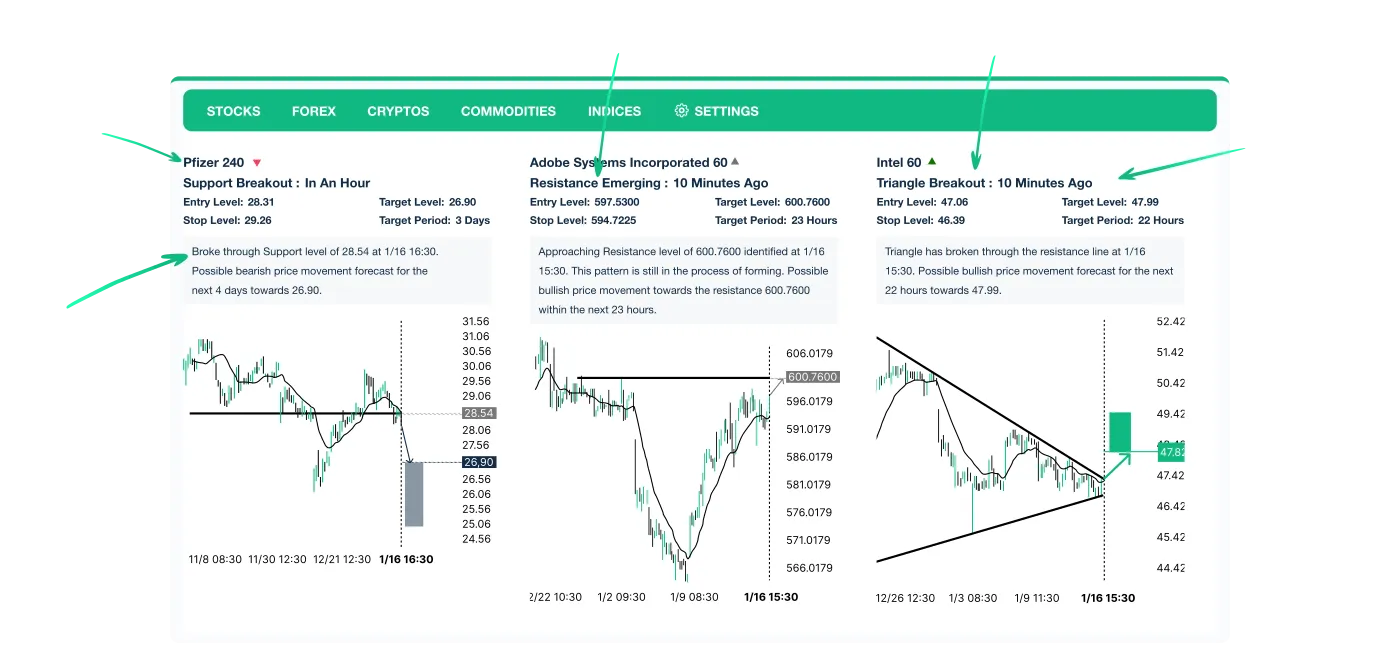
 Ascending Triangle
 Descending Triangle
 Triangle
 Channel Down
 Channel Up
 Rising Wedge
 Falling Wedge
 Rectangle
 Head and Shoulders
 Inv. Head & Shoulders
 Triple Top
 Triple Bottom
 Flag
Flag Pennant
 Double Top
 Double Bottom
 Time Symmetry
 Price Symmetry
 Clarity
 Butterfly
 Gartley
 3 Point Extension
 ABCD
ABCD 3 Point Retracement
 3 Drive
 Big Movement
 Consecutive candles
 Dragonfly Doji
 Bearish 3 Line Strike
 Bullish Engulfing
 Bearish Harami
 Tweezers Top
 Bearish Engulfing
 Hanging Man
 Shooting Star
 Hammer
Market Coverage
Stocks (hourly / 15-minute data), Currencies (15-minute data), Indices (hourly data), ETFs (hourly data) and Cryptocurrencies (15-minute data).
Highlights
- The Technical Analysis web component is updated every 15 minutes with new trade setups based on all Autochartist analysis types.
- Automatically detects actionable, high-probability trading opportunities.
- Delivers technical trade ideas and setups identified via Technical Analysis.
- Automatically identifies Chart Patterns, Fibonacci Patterns, Horizontal Support and Resistance levels.
- Assists in identifying market trends and reversals.